
Price gaps are an important phenomenon on price charts, signaling a significant shift in how market participants perceive the value of an asset. In technical analysis, recognizing and interpreting price gaps can offer valuable insights into potential future price movements.
What Is a Price Gap?
A price gap is an area on a chart where no trading activity has occurred. It most commonly appears on daily charts, where the opening price of a new session is clearly separated from the previous day’s price range.
Price gaps are categorized as bullish (gap up) or bearish (gap down). They are more common in traditional markets like stocks or commodities, where trading sessions are time-limited. In contrast, on the cryptocurrency market—which operates 24/7—price gaps are rarer and usually result from major events or groundbreaking announcements that shift the perceived value of a cryptocurrency.
Example of a Bullish Gap
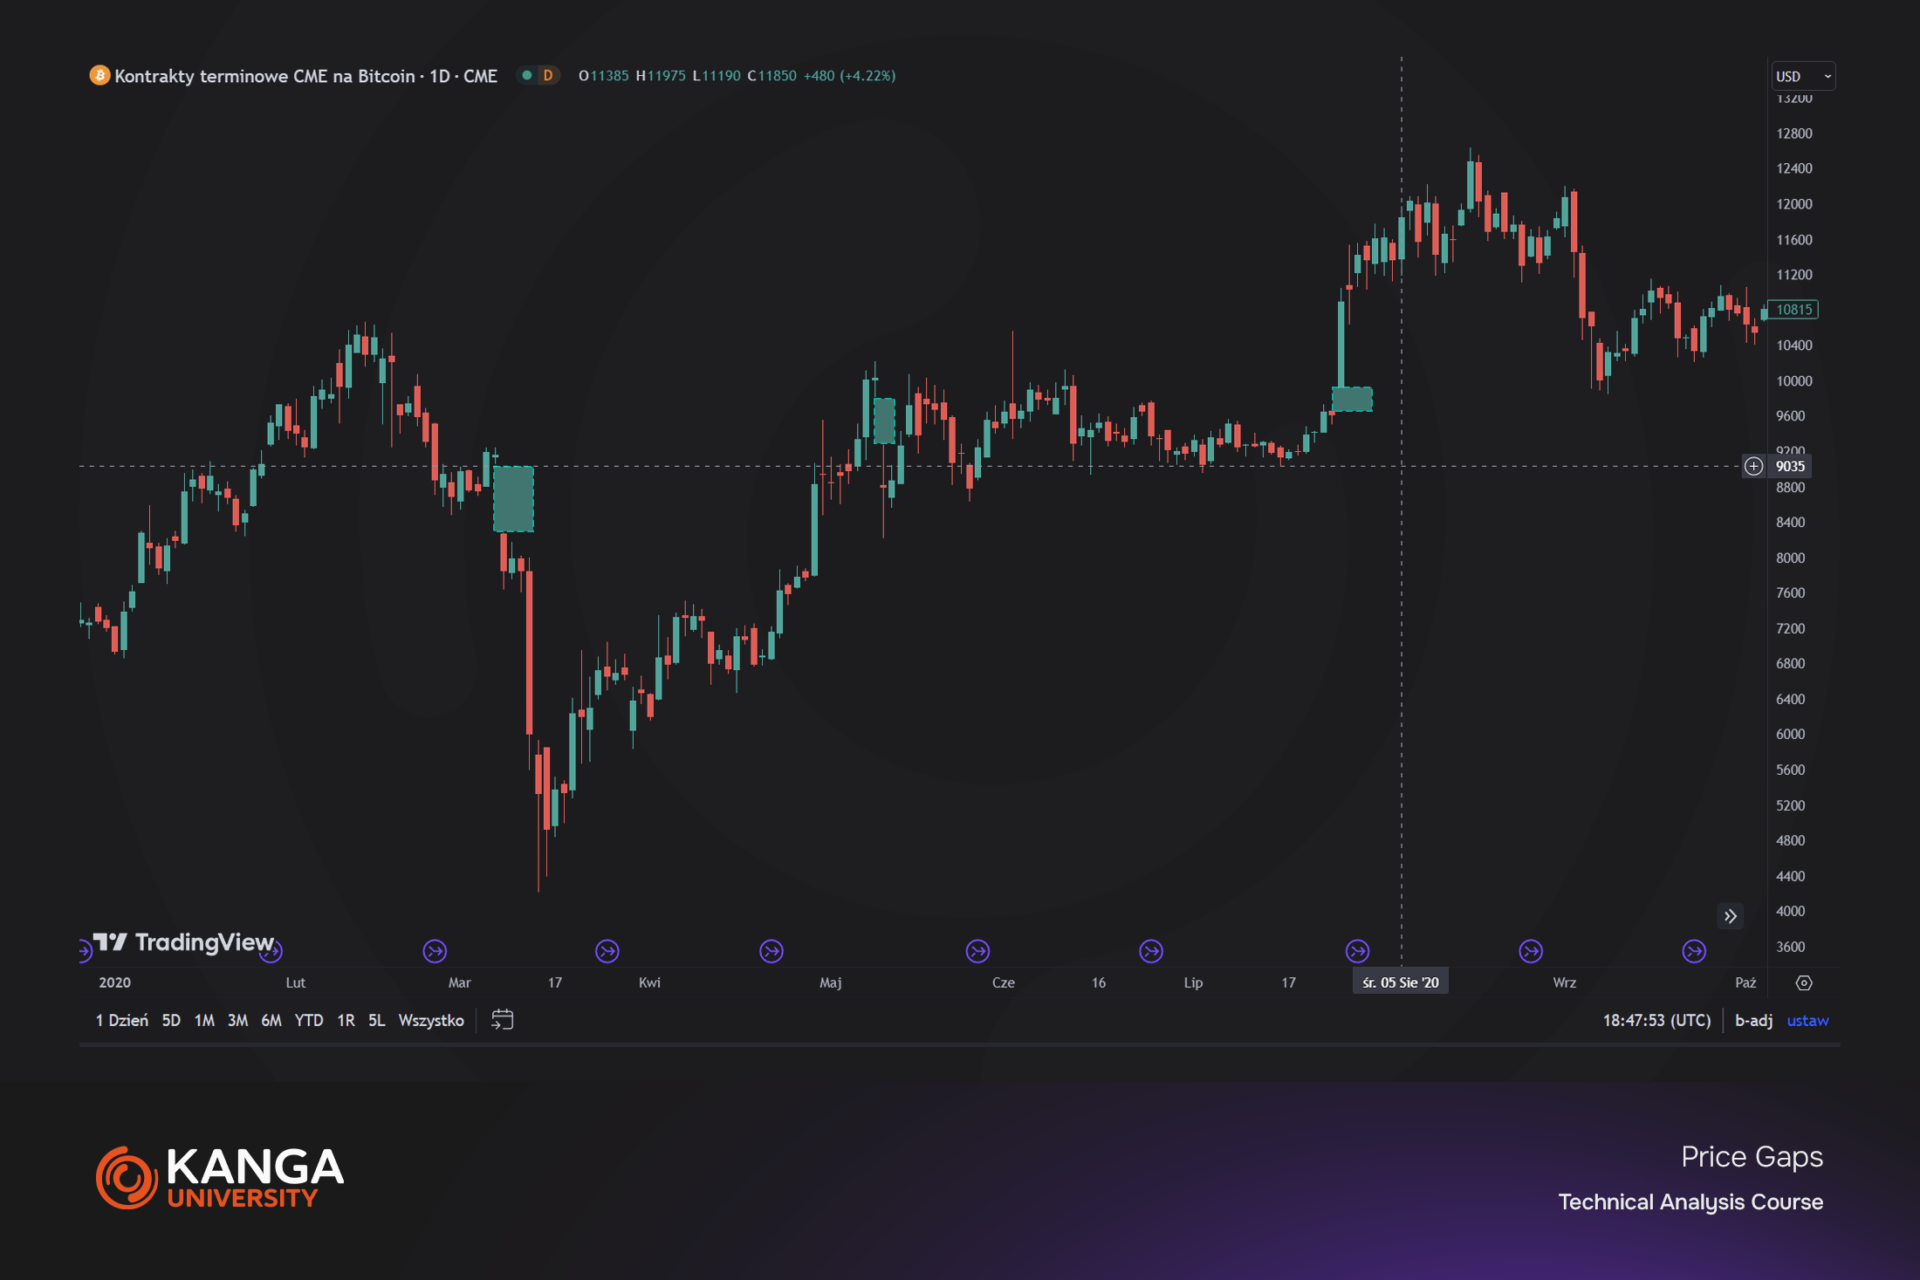
A bullish gap may occur following positive news, such as a major company adopting a cryptocurrency or the introduction of favorable regulations. A notable example is the bullish gap on the CME Bitcoin chart in July 2020, which ended a consolidation phase and kicked off a new bull run. Similarly, if Ethereum (ETH) closes at $2,000 and opens the next day at $2,500 following the legalization of cryptocurrencies by a major country, a bullish gap is formed—the lack of trading between $2,000 and $2,500 reflects a surge in market interest and a shift in sentiment.
Types of Gaps
-
Common Gap: Appears unexpectedly without a clear cause. It tends to “fill” quickly and is not seen as a strong market signal.
-
Breakaway Gap: Forms due to important market news or technical breakouts. It marks the beginning of a new trend and often acts as strong support or resistance.
-
Runaway (Continuation) Gap: Occurs during a strong trend, usually in its middle phase, indicating continuation of the current direction.
-
Exhaustion Gap: Appears near the end of a long price move, signaling potential trend reversal.
The Three-Gap Rule
This rule suggests that during strong trends, three types of gaps may appear: breakaway, continuation, and exhaustion. The final exhaustion gap may signal an upcoming trend reversal.
Island Reversal
This is a specific formation consisting of two opposite gaps (one bearish and one bullish), forming a short-term reversal signal. Though rare, island reversals are powerful indicators of trend changes.
Trading Strategies
-
Breakaway Gap: Consider entering a position in the direction of the new trend.
-
Runaway Gap: Confirms a continuing trend—a good time to hold your position.
-
Exhaustion Gap: Signal to close your position or take the opposite side, anticipating a reversal.
-
Island Reversal: An opportunity to enter a position opposite to the previous trend.
Summary
Price gaps provide important information about market dynamics and are a key tool in technical analysis. By correctly interpreting gaps, investors can gain a clearer view of potential price directions and adjust their trading strategies accordingly. However, no method guarantees success—risk management should always be a part of your trading plan.