
Price channels are a technical analysis tool that helps investors understand potential future support and resistance levels. They are created by two parallel trendlines: a support line (bottom) and a resistance line (top). These channels help investors determine the price range within which an asset is likely to move.
Structure of a Price Channel
-
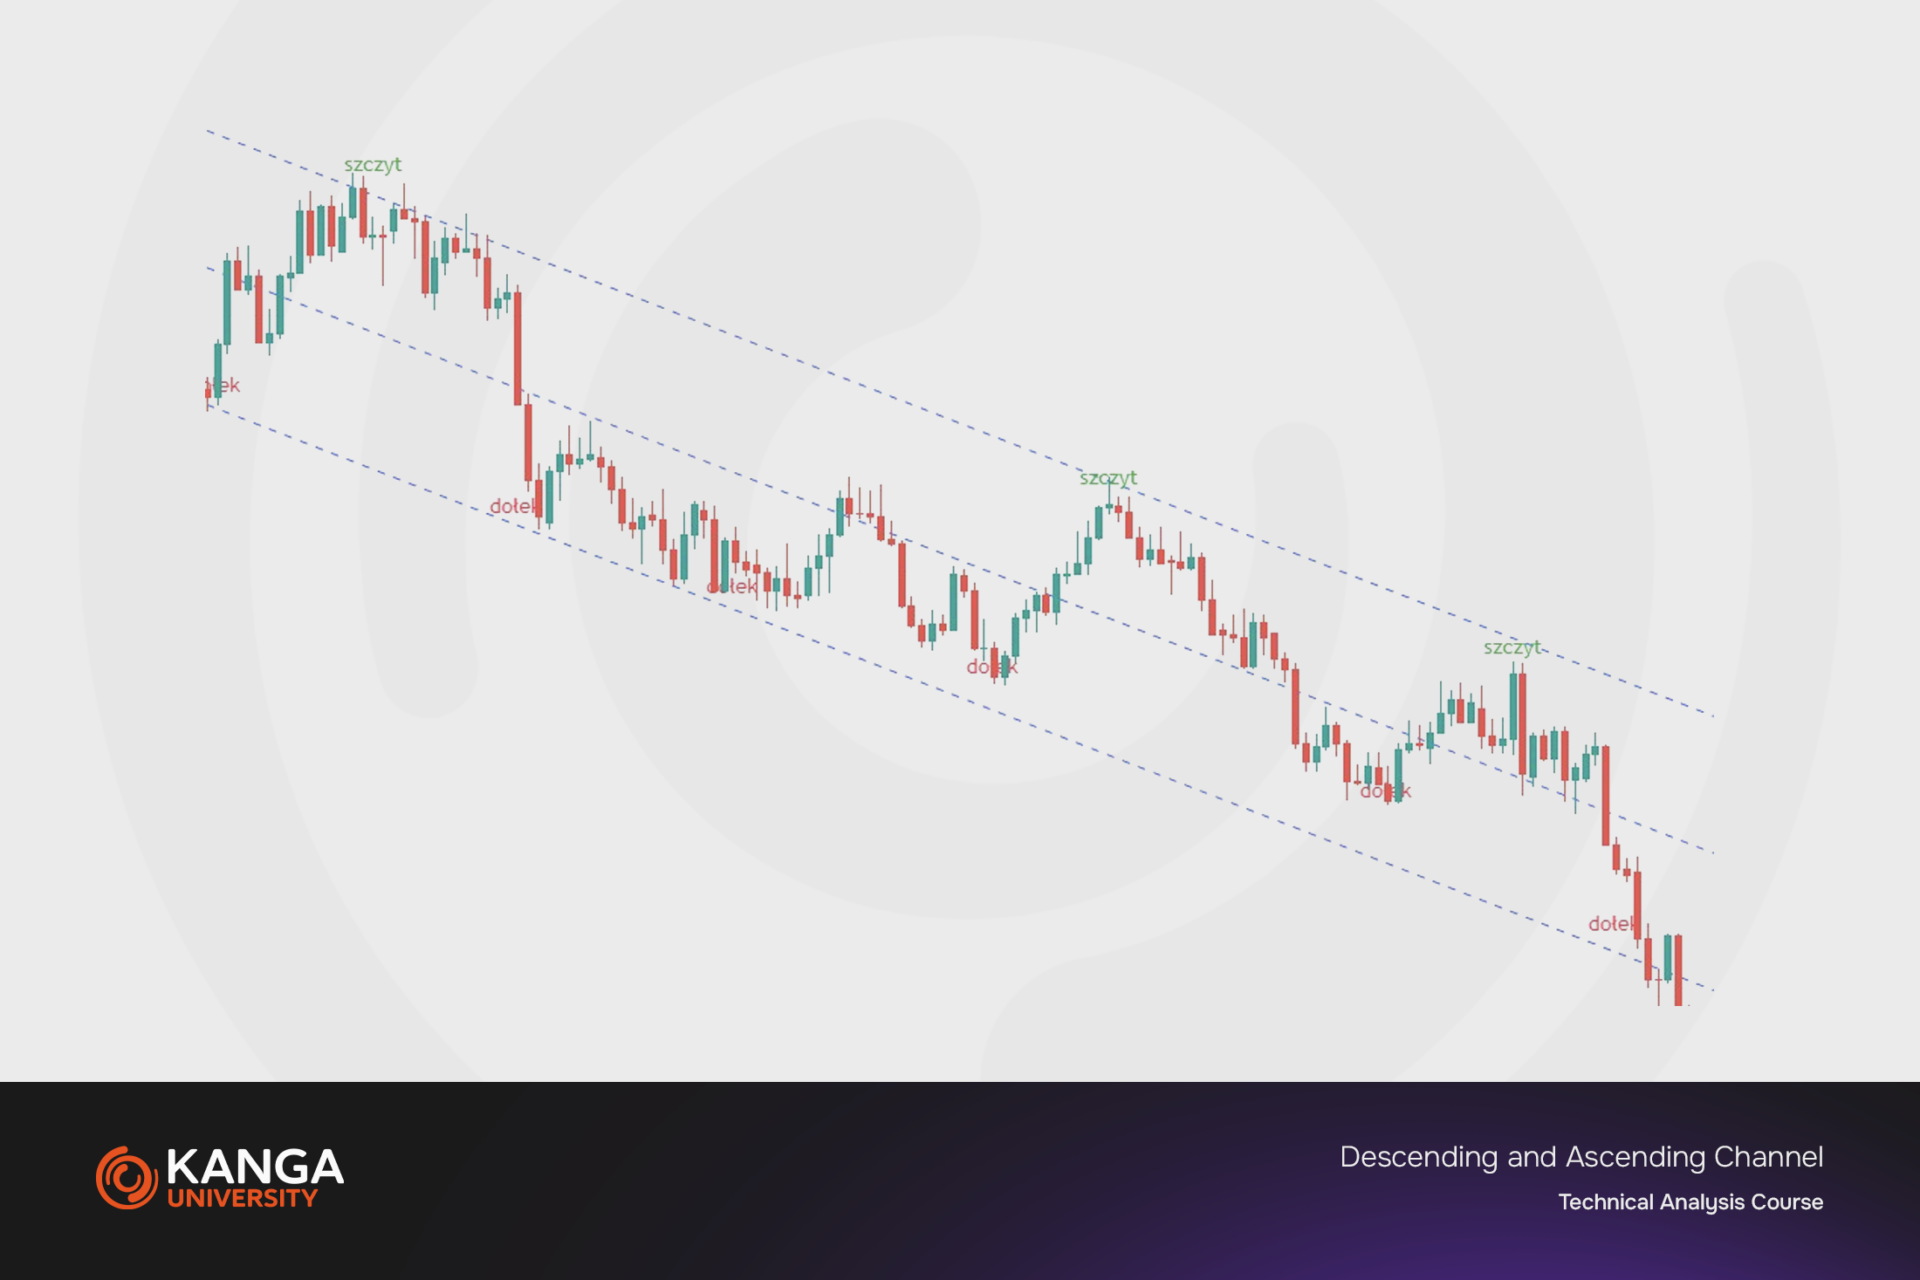
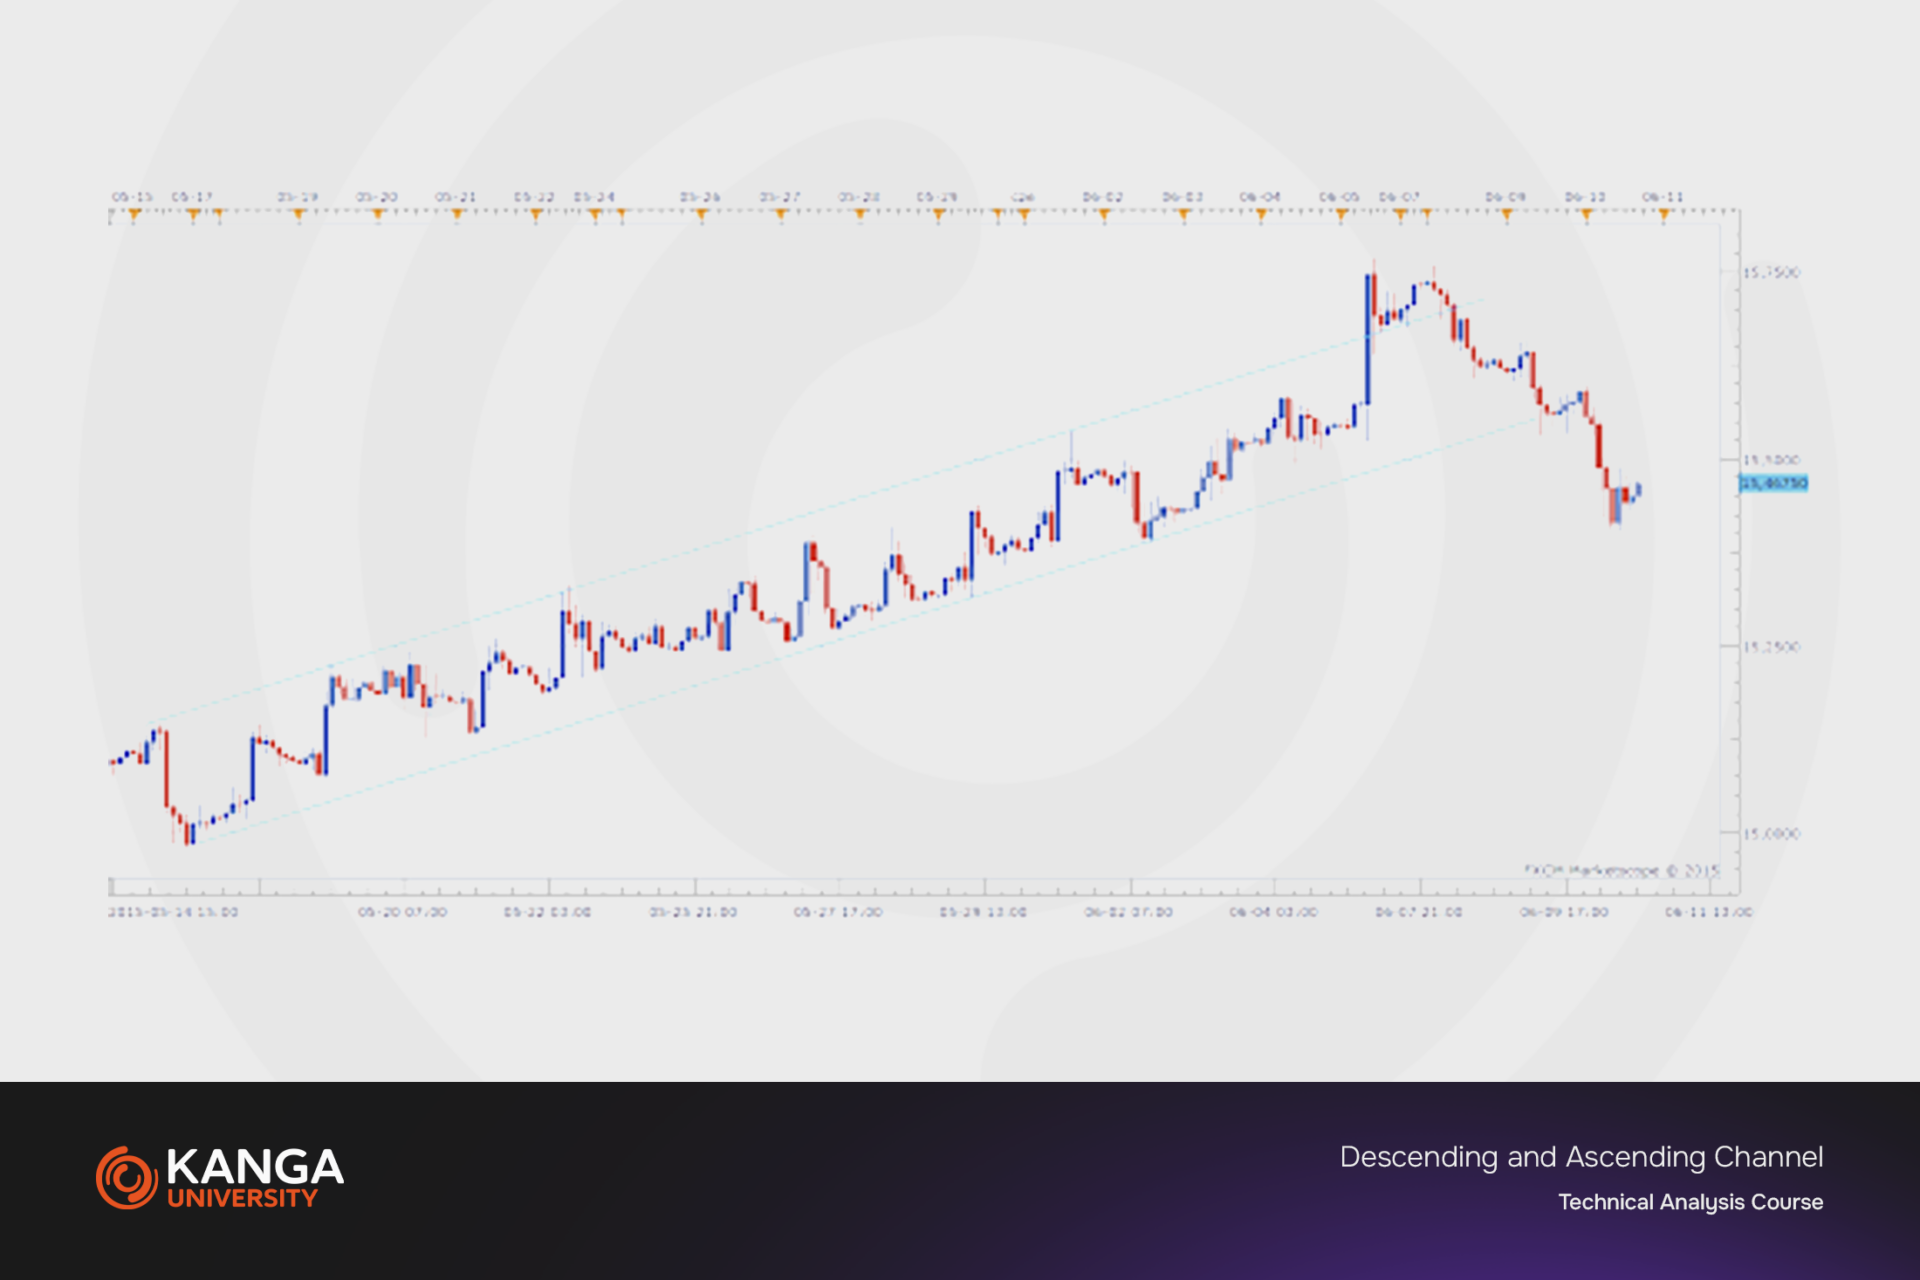
Selecting Turning Points: Start by identifying key turning points on the chart that will serve as the basis for drawing trendlines. For the support line, choose at least two significant lows; for the resistance line, at least two highs.
-
Drawing Trendlines: Connect the selected turning points to draw the support and resistance lines. These lines should be parallel to each other and together form the price channel.
-
Channel Interpretation:
-
Support: The lower boundary of the channel, where the asset price tends to bounce upward.
-
Resistance: The upper boundary, where the asset price tends to reverse downward.
-
Breakout: If the asset price breaks through either boundary, it may signal a trend reversal or continuation.
-
Trading Strategies Using Price Channels
-
Trading Within the Channel: Buy near the support line and sell near the resistance line, assuming the price will continue to move within the channel.
-
Breakout Trading: Take a long position when the price breaks above the resistance line (suggesting a potential upward trend), or a short position when it breaks below the support line (suggesting a potential downward trend).
Advantages and Disadvantages of Price Channels
Advantages:
-
Provide a visual representation of the trend and potential reversal points.
-
Help forecast the range of price volatility.
Disadvantages:
-
Channels can be subjective, depending on how the investor selects the turning points.
-
Prices do not always stay within the channel, which may lead to false signals.
Example of Use
Let’s say you are analyzing the stock chart of XYZ and identify a series of higher highs and higher lows. By connecting the lowest points, you create the support line; by connecting the highest points, you draw the resistance line. Observing how the price bounces between these lines, you can predict it will continue moving within the channel until a breakout occurs—potentially signaling a change in the current trend.
Summary
Price channels are an effective technical analysis tool, providing insight into potential support and resistance levels and helping to identify trends. While they are useful, investors should also rely on other technical and fundamental tools to confirm signals and make more informed investment decisions.