
In technical analysis, alongside price, volume plays a crucial role in understanding market dynamics. It is one of the most important pieces of information that investors and traders can use to assess the strength of a price movement. In this lesson, we will explore how volume, combined with Open Interest, can provide valuable insights into the possible direction of the market.
Volume – What Is It?
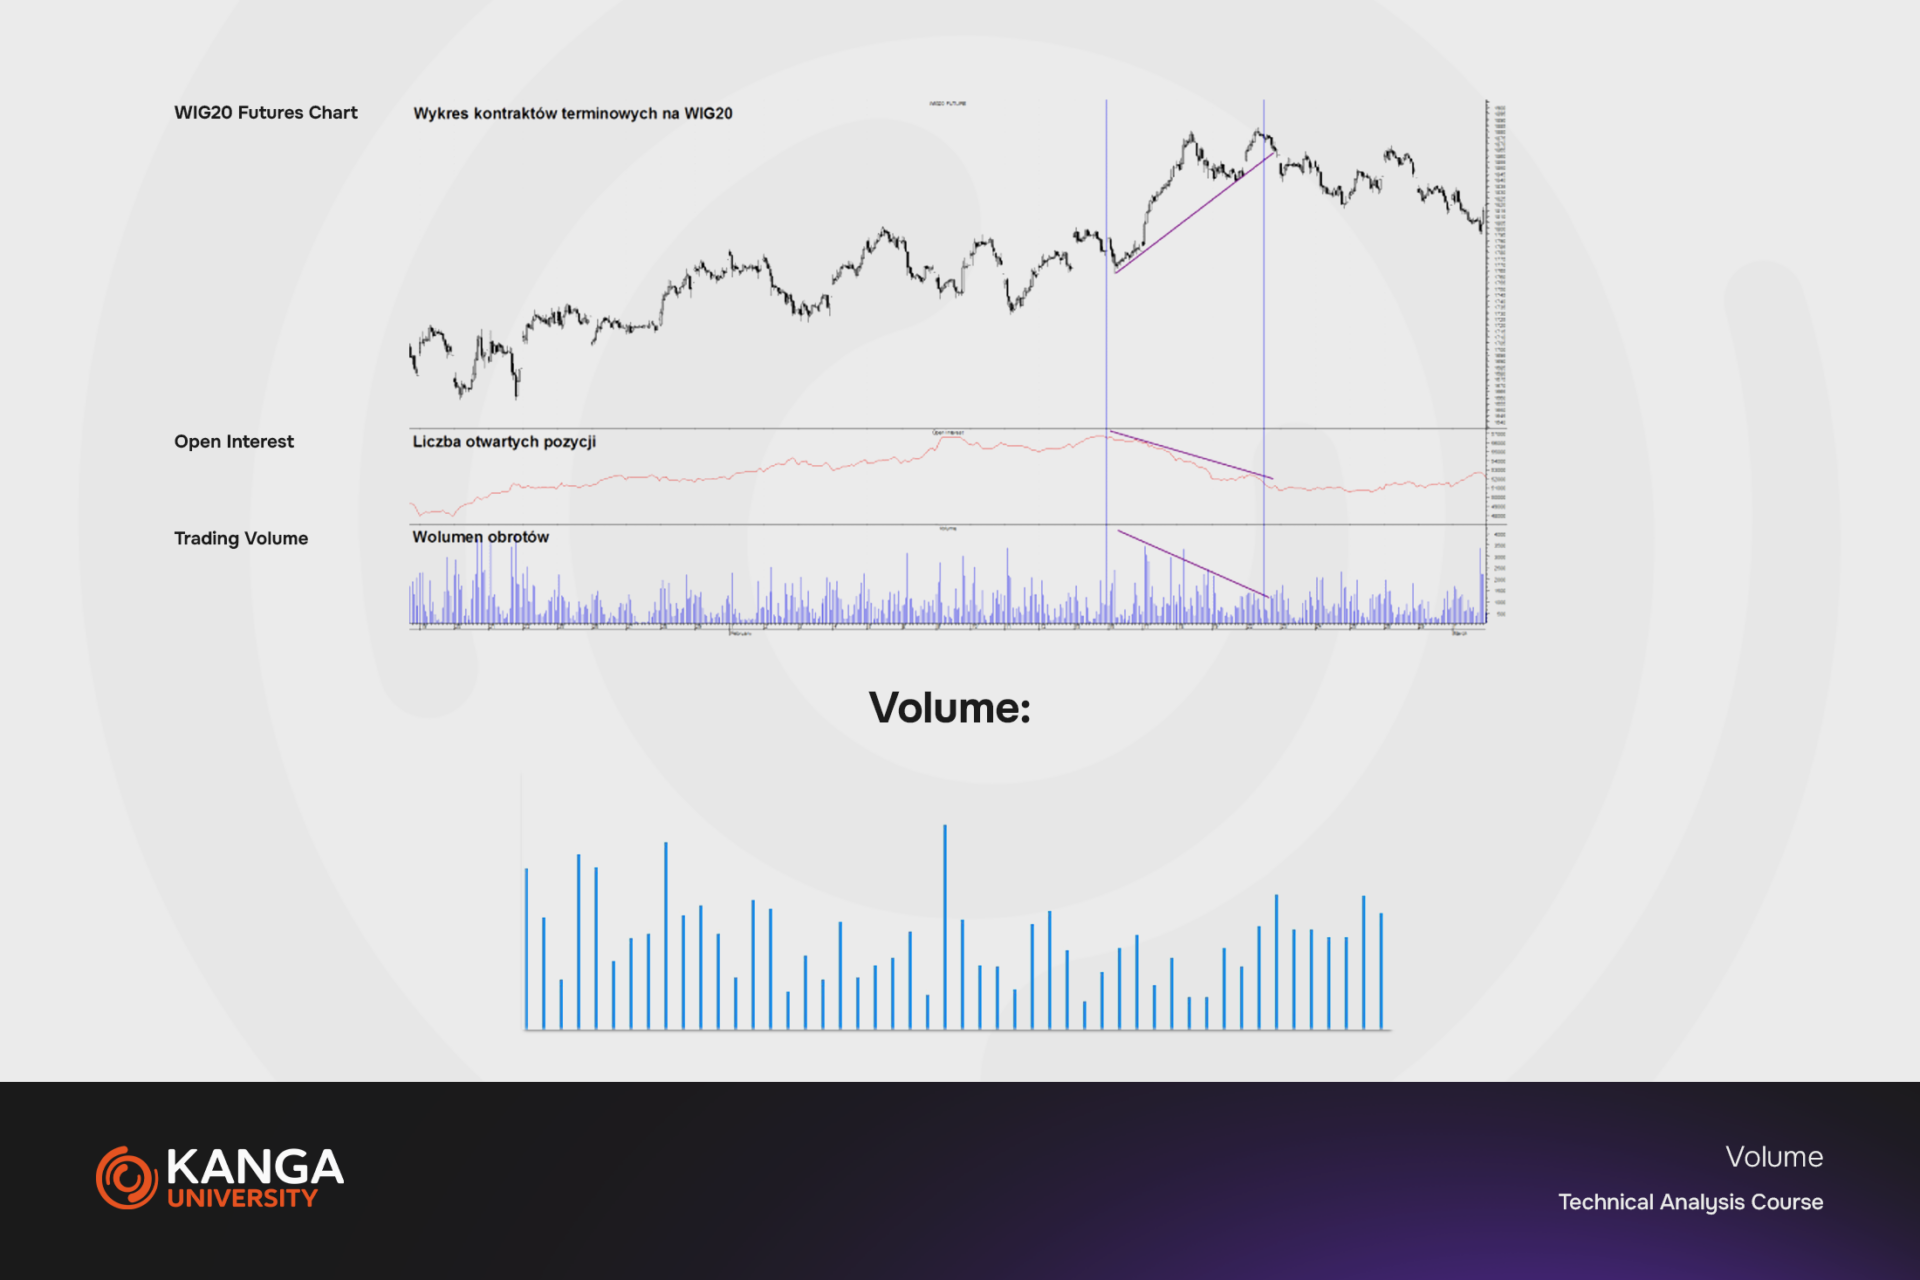
Volume represents the total number of shares, contracts, or other financial instruments traded during a given time period. High volume may indicate strong interest in a given asset, often associated with significant market events or shifts in investor sentiment. Conversely, low volume may signal a lack of interest or market uncertainty.
Open Interest (OI)
Open Interest refers to the total number of outstanding futures contracts or options that have not yet been closed or settled. A rising OI indicates new market participation, while a decline signals position closing and liquidation.
How to Interpret Volume and Open Interest?
-
Price increase + rising volume + rising OI = Strong Market
When price rises are accompanied by increasing volume and OI, this signals a continuation of the uptrend. Rising OI suggests new market participants are opening positions, potentially fueling further gains. -
Price decline + rising volume + rising OI = Weak Market
If prices are falling while both volume and OI are rising, this may indicate a strong downtrend. New positions may reflect investors expecting further declines. -
Volume changes without significant price movement
Significant volume changes not accompanied by notable price moves may signal accumulation or distribution by large players. For instance, a sudden volume spike with stable prices could indicate that “smart money” is accumulating assets—possibly preceding a price increase. -
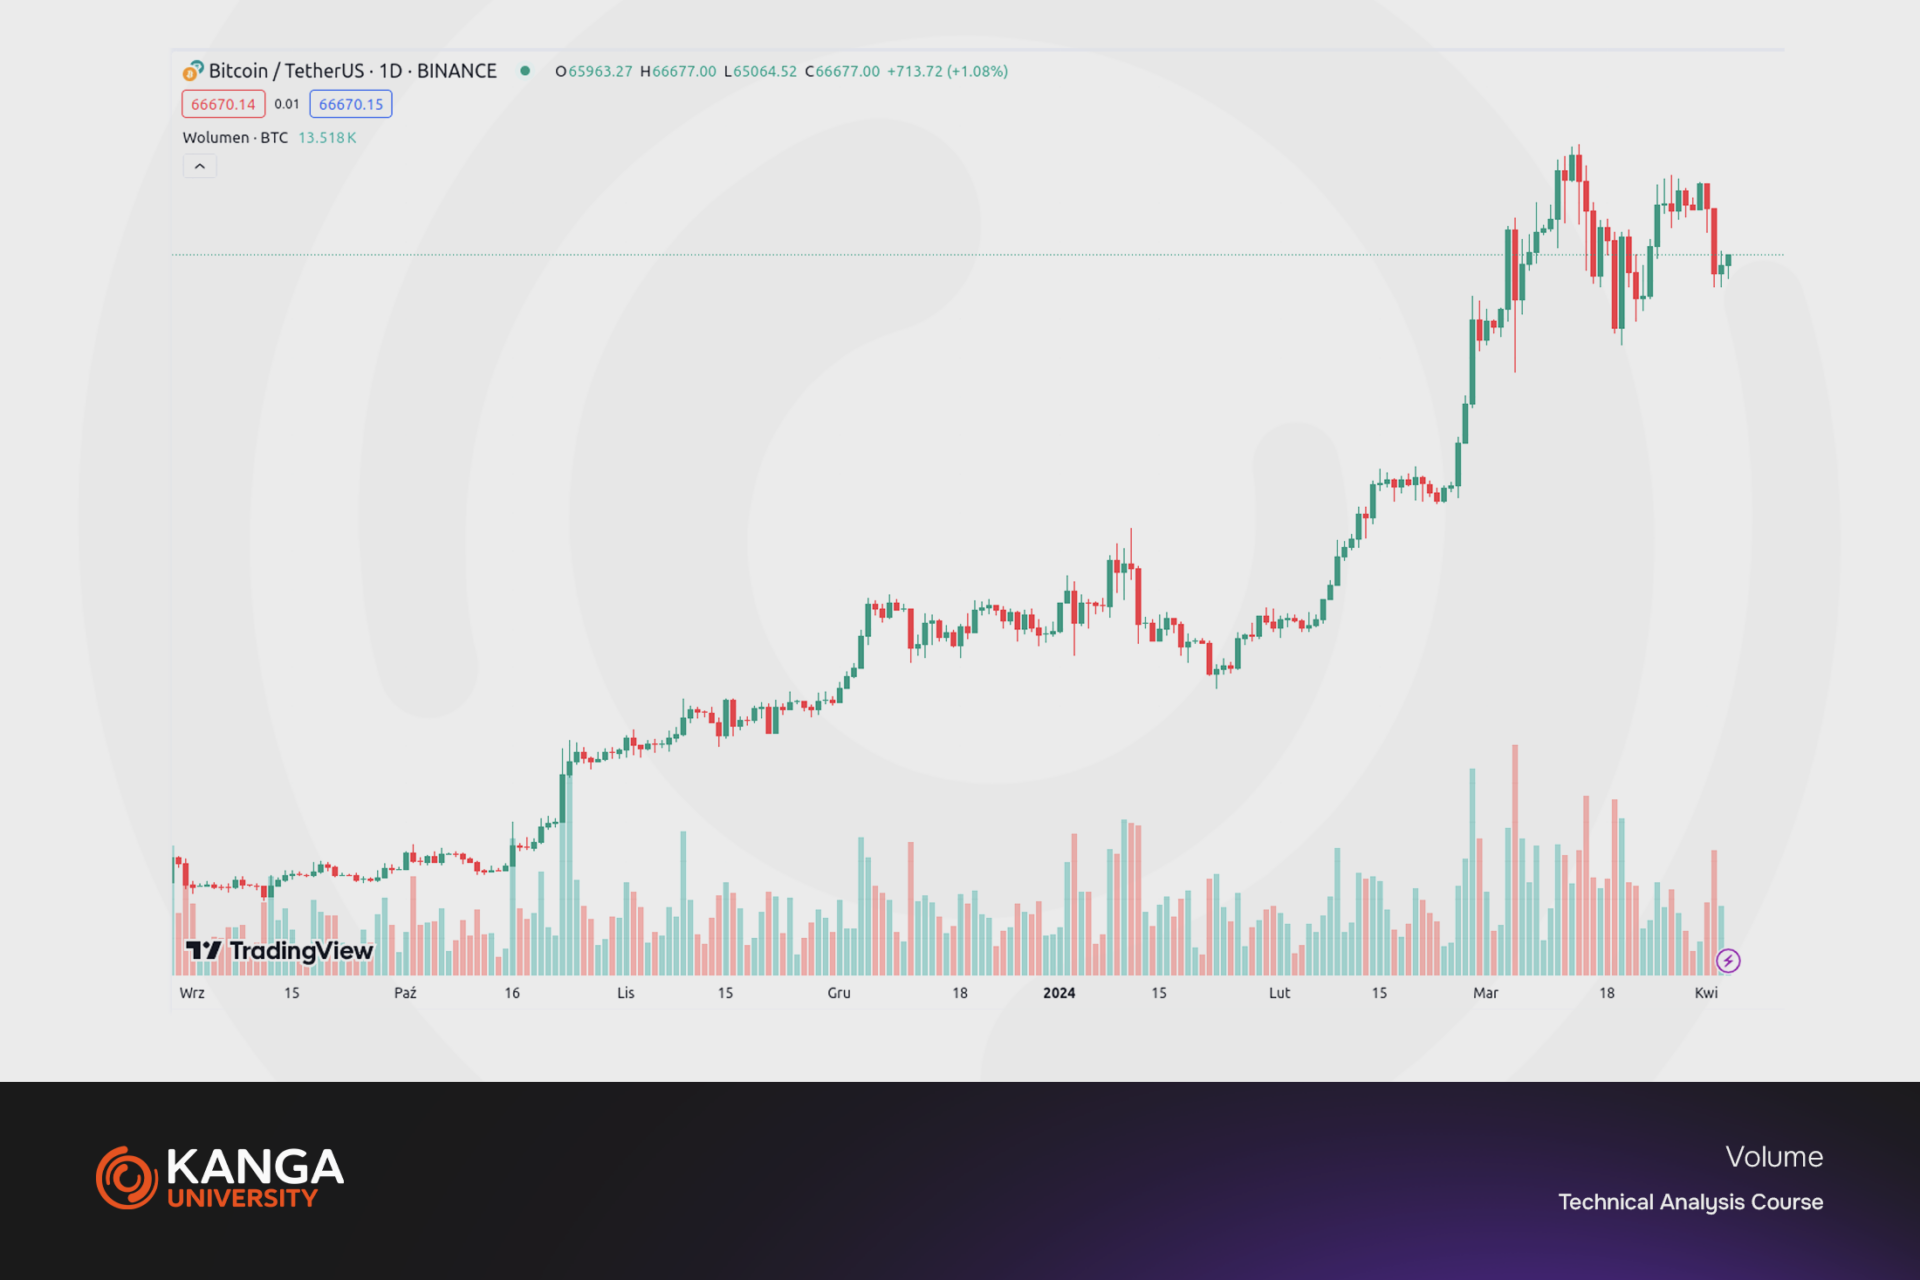
Volume spikes
A sudden, one-day surge in volume—known as a volume spike—often precedes a trend reversal. Volume increases at support or resistance levels may signal potential breakouts.
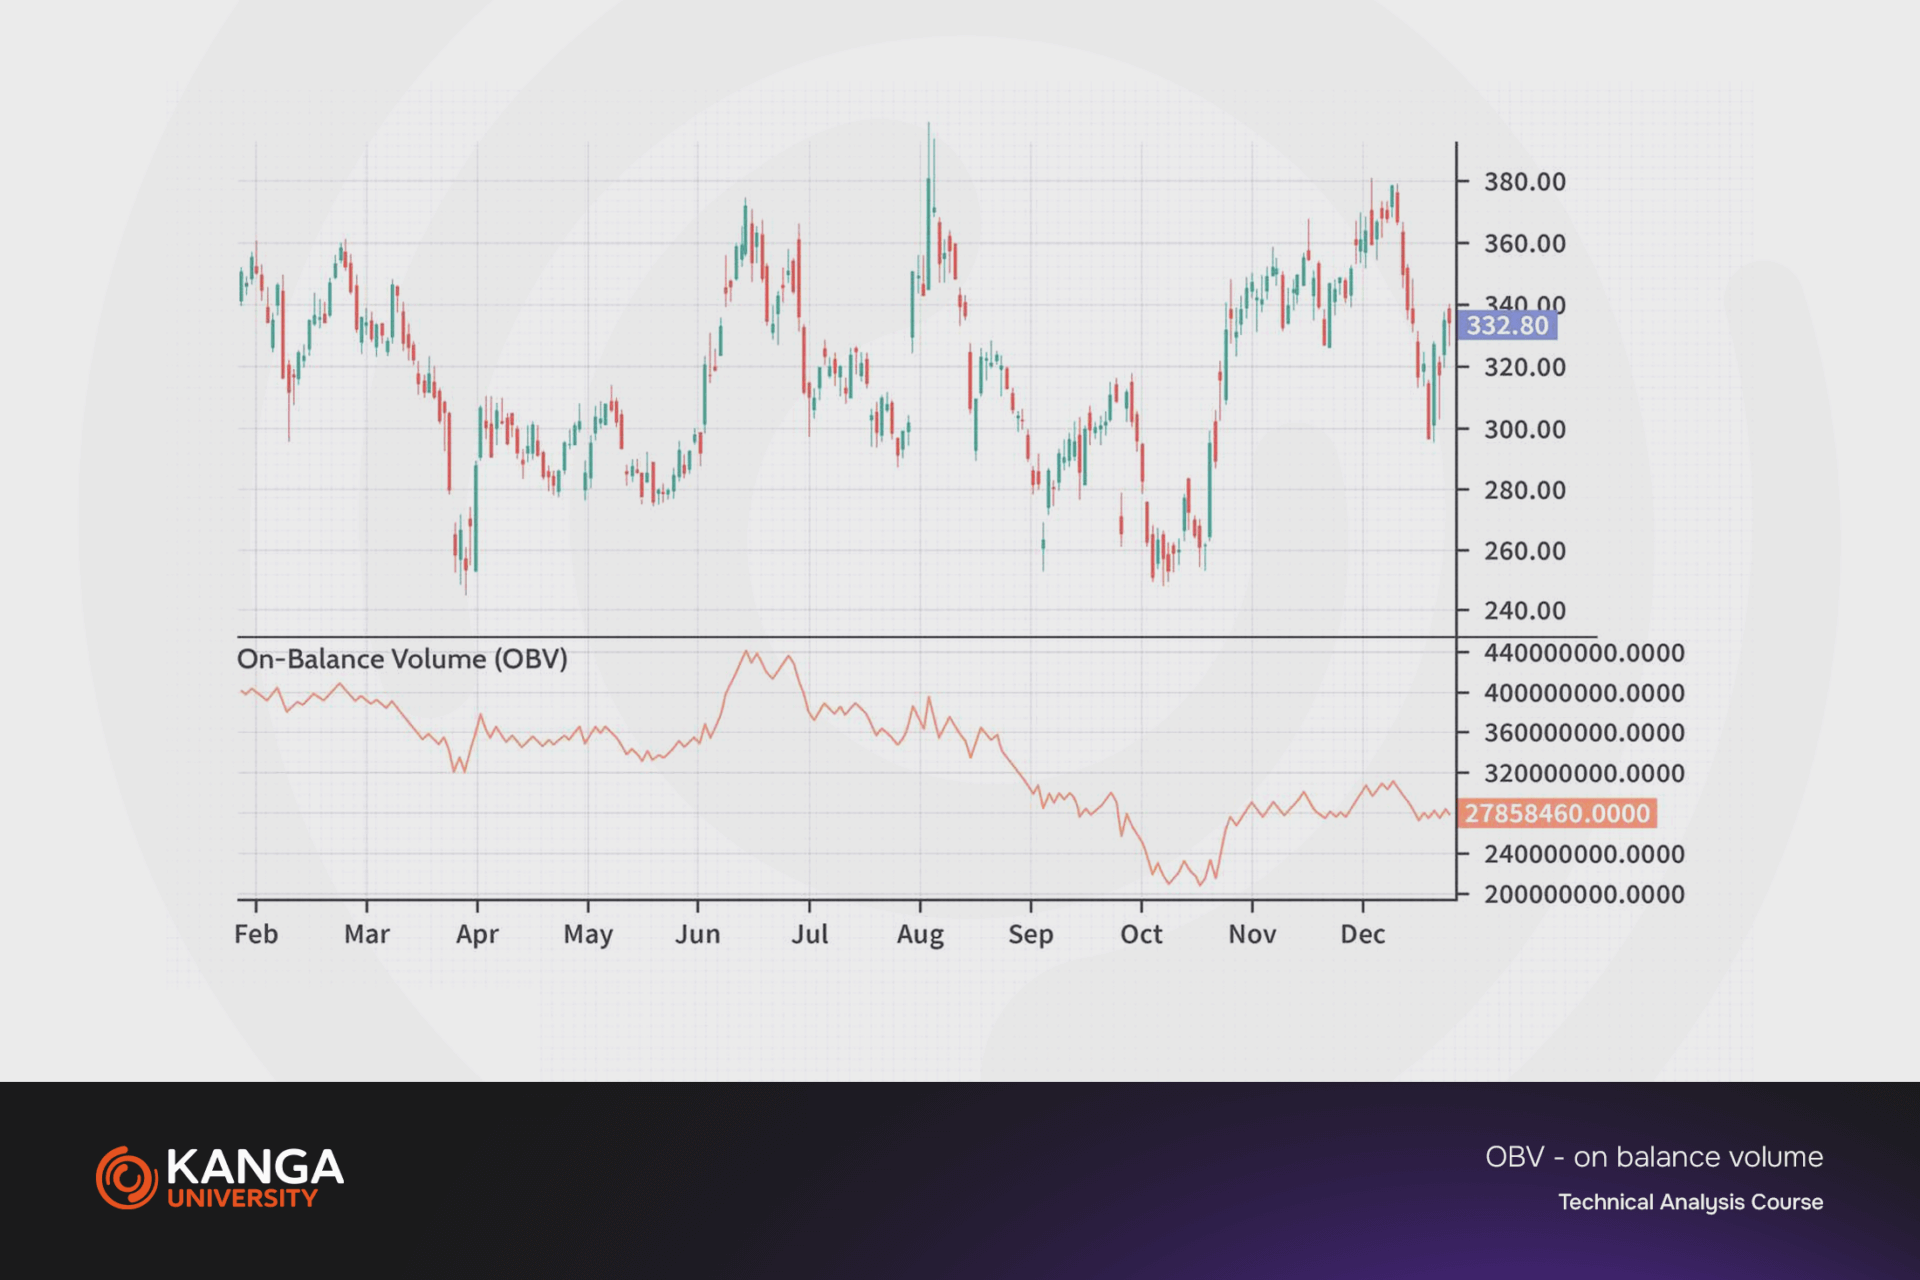
OBV Line (On-Balance Volume)
The On-Balance Volume (OBV) line is a tool that tracks the flow of volume into and out of the market by adding volume on up days and subtracting it on down days. If the OBV line is rising, it means that volume is on the buyers’ side, which can be bullish for price. A declining OBV line suggests volume is on the sellers’ side, which may be bearish.
Practical Application
In practice, investors and traders should monitor both volume and Open Interest to better understand market behavior. A volume increase combined with a corresponding price move confirms the strength of that movement. It’s also valuable to watch for divergences between price and volume, which may indicate a potential trend reversal.
Volume is not just a measure of market activity—it is also a powerful indicator that can confirm or question the validity of price movements. Using this information in combination with price analysis can significantly improve the effectiveness of your investment decisions.