In previous lessons, we discussed the basic chart types used in technical analysis: line charts, bar charts, and candlestick charts. In this section, we’ll focus on another important aspect of chart analysis—the scale on which the data is presented. There are two main types of chart scales: arithmetic and logarithmic. The choice of scale significantly affects how we interpret price movements and market trends.
Arithmetic Scale
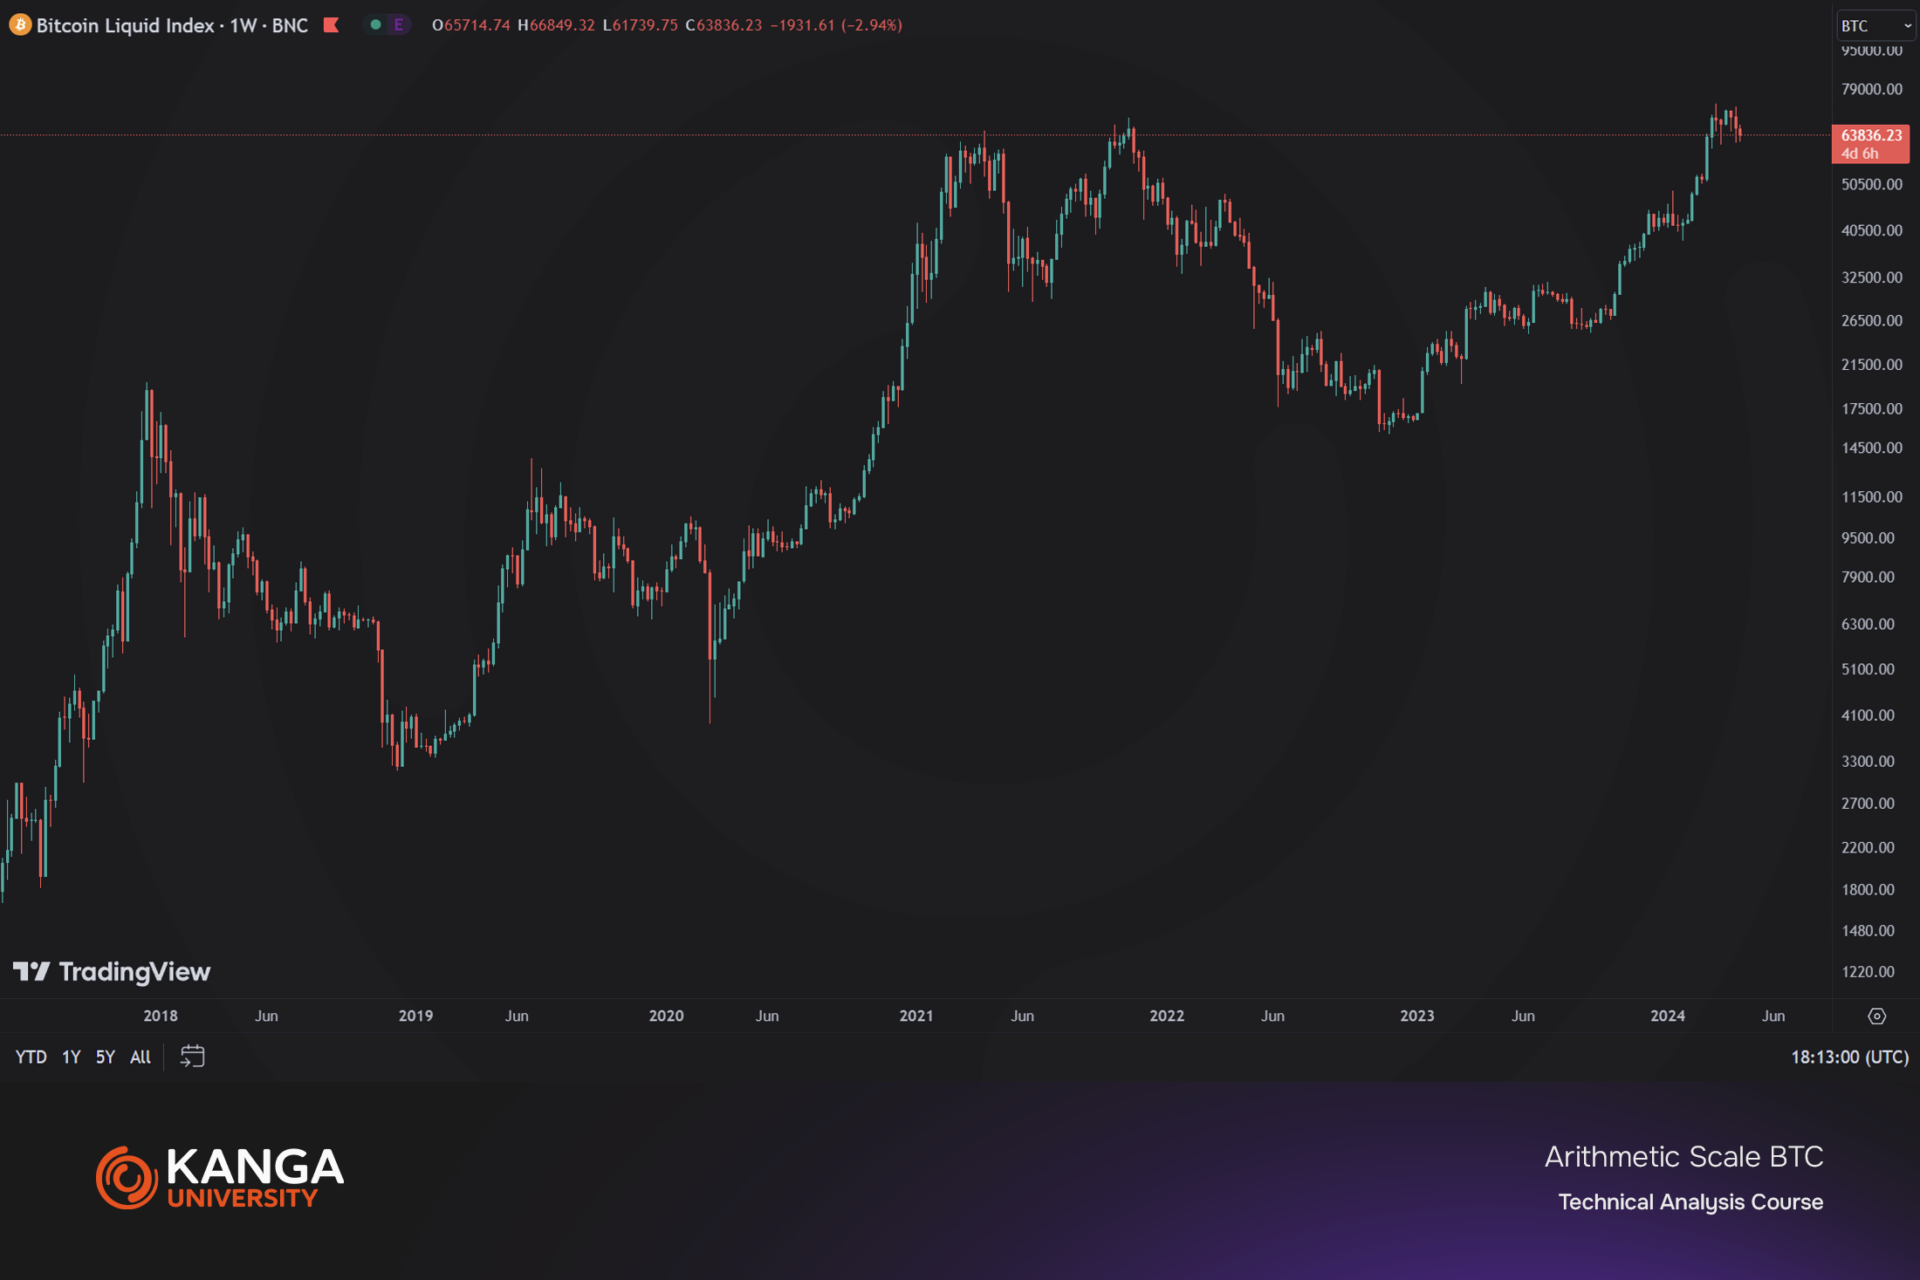
On an arithmetic scale, each vertical unit (Y-axis) represents the same absolute value across the entire chart. This means that a price change from 10 to 20 is shown with the same vertical distance as a change from 90 to 100—both are displayed equally on the chart. The arithmetic scale is especially useful for short-term market analysis, where observing small price changes in detail is crucial.
Advantages: Simple to interpret; ideal for short-term trading strategies.
Disadvantages: Can be misleading when analyzing long-term trends, as it doesn’t reflect the relative significance of percentage price changes.
Logarithmic Scale
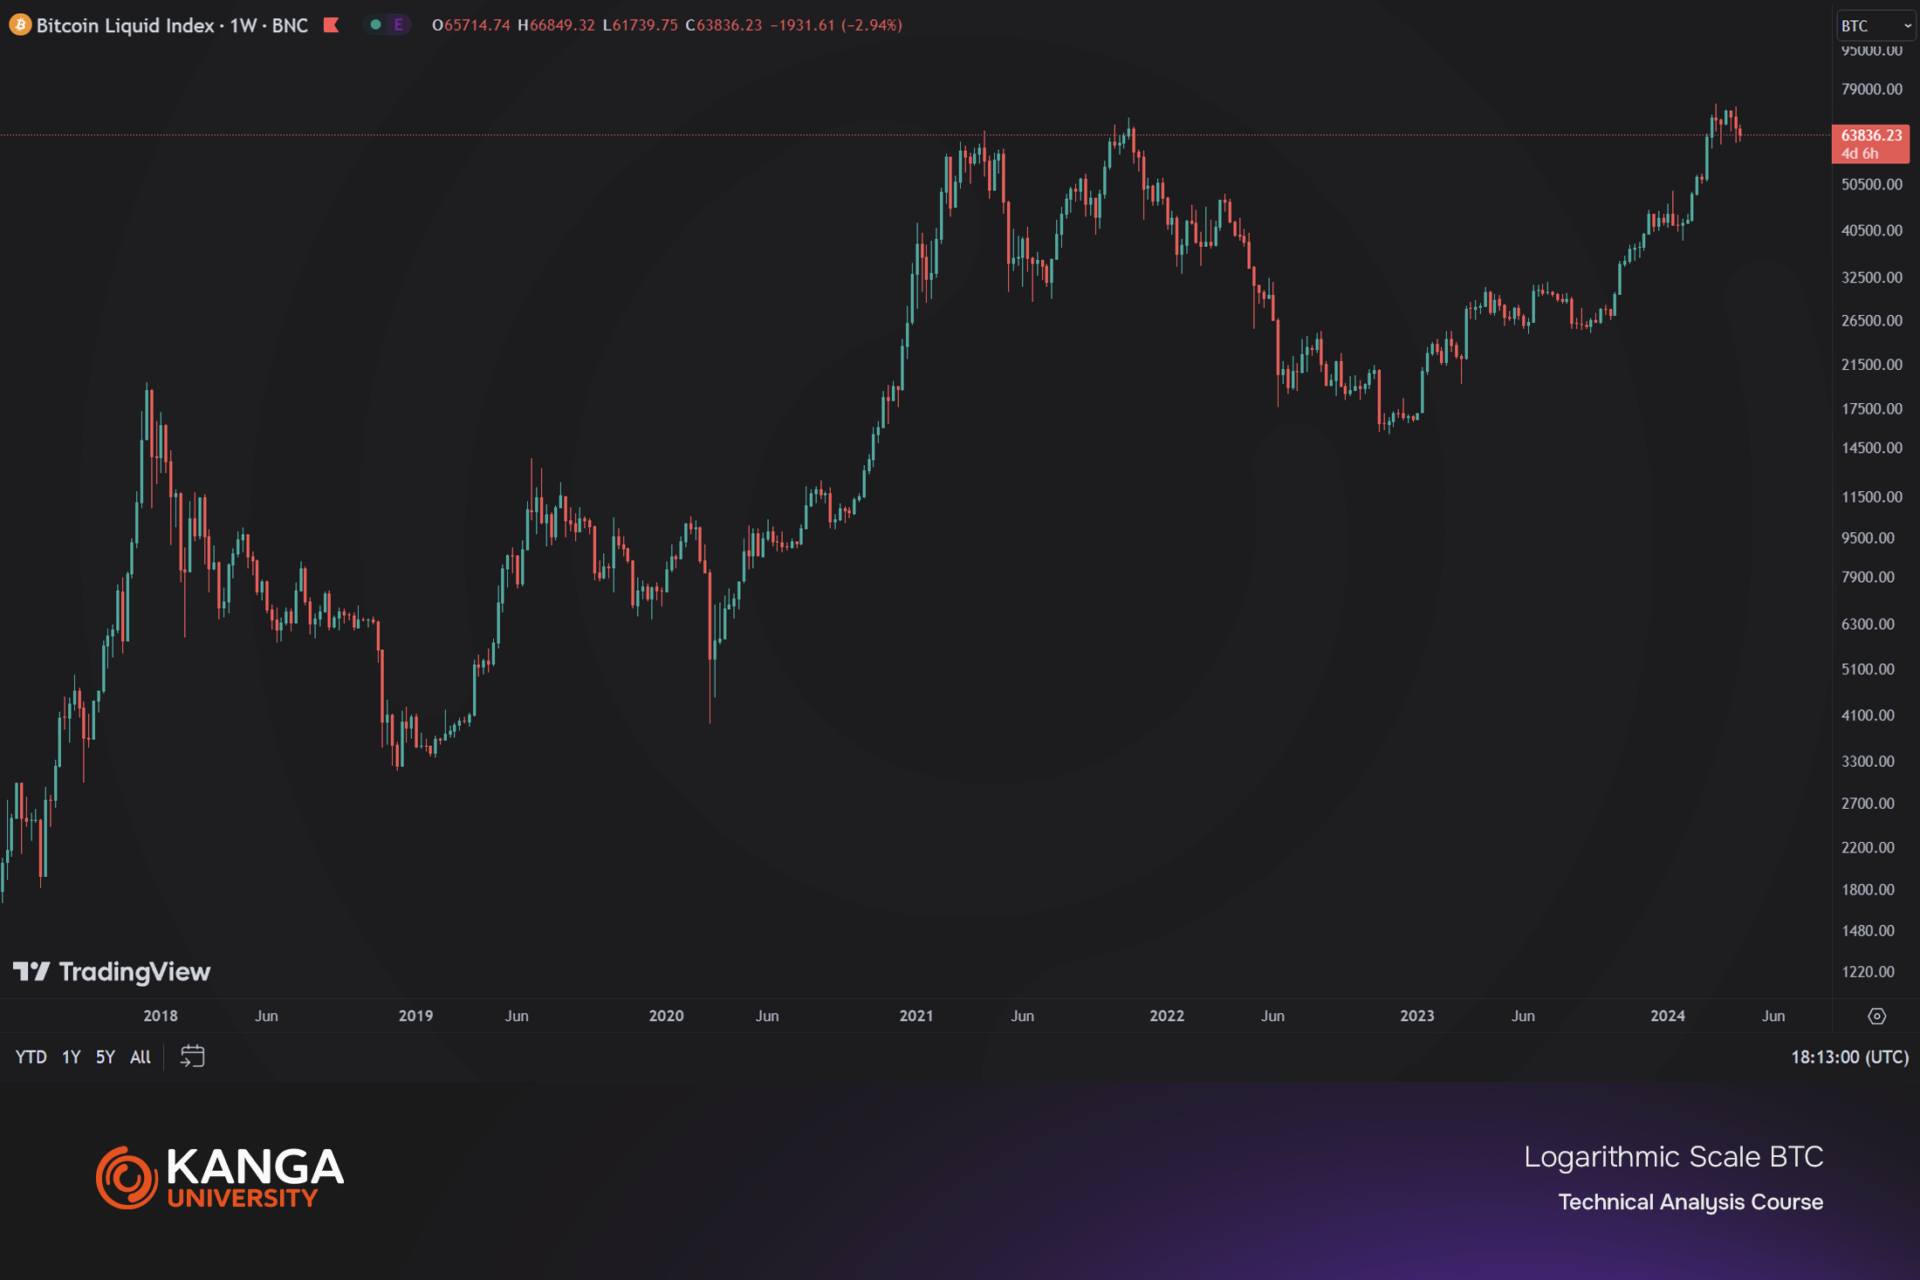
The logarithmic scale, also known as the percentage scale, differs from the arithmetic one in that the vertical distances represent percentage changes rather than absolute value changes. This means a price increase from 10 to 20 (a 100% increase) is represented by the same distance on the chart as an increase from 20 to 40 (also a 100% increase). The logarithmic scale is particularly useful in long-term trend analysis, as it accounts for relative price volatility across various price levels.
Advantages: Makes it easy to compare percentage price changes across different price ranges; ideal for long-term analysis and trend identification.
Disadvantages: Can be harder to interpret for beginners; less useful for short-term market analysis.
Practical Application
The choice between an arithmetic and logarithmic scale should depend on your trading goals and investment timeframe. Short-term traders may prefer the arithmetic scale for its simplicity and focus on absolute price changes. In contrast, long-term investors should consider using the logarithmic scale to better understand percentage price movements and long-term trends.
When to Use Each Scale?
-
Arithmetic scale is most appropriate for short-term market analysis. If you’re focused on daily price fluctuations or analyzing data from shorter periods, an arithmetic scale may better reflect the dynamics of price movement.
-
Logarithmic scale is better suited for analyzing long-term trends. It helps reveal patterns in historical data spanning many years, especially when price values vary significantly.
Example
Let’s say we’re analyzing the price chart of a company whose stock rose from 10 to 1,000 over 10 years. On an arithmetic scale, most of the trends and price formations from the early period would be nearly invisible due to the dominance of higher values at the end. A logarithmic scale, however, allows us to view the entire price history in a more balanced way, showing relative price changes instead of just absolute values.
Summary
Remember, the choice of chart scale should be driven by the purpose of your analysis and the nature of the data being examined. When analyzing charts, it’s worth experimenting with both arithmetic and logarithmic scales to find the most insightful perspective.
Always pay attention to the scale used when reading charts. Using the wrong scale can lead to misinterpretation and poor investment decisions. For example, ignoring logarithmic scaling during long-term analysis may cause you to underestimate the impact of large percentage price changes.