
Trend continuation patterns are chart formations that indicate a temporary pause in the current market trend and suggest that, after a brief consolidation, the trend is likely to resume. These patterns are essential for investors and traders because they help identify the best moments to enter or exit a position in line with the prevailing trend. Below, we discuss several popular trend continuation patterns with examples.
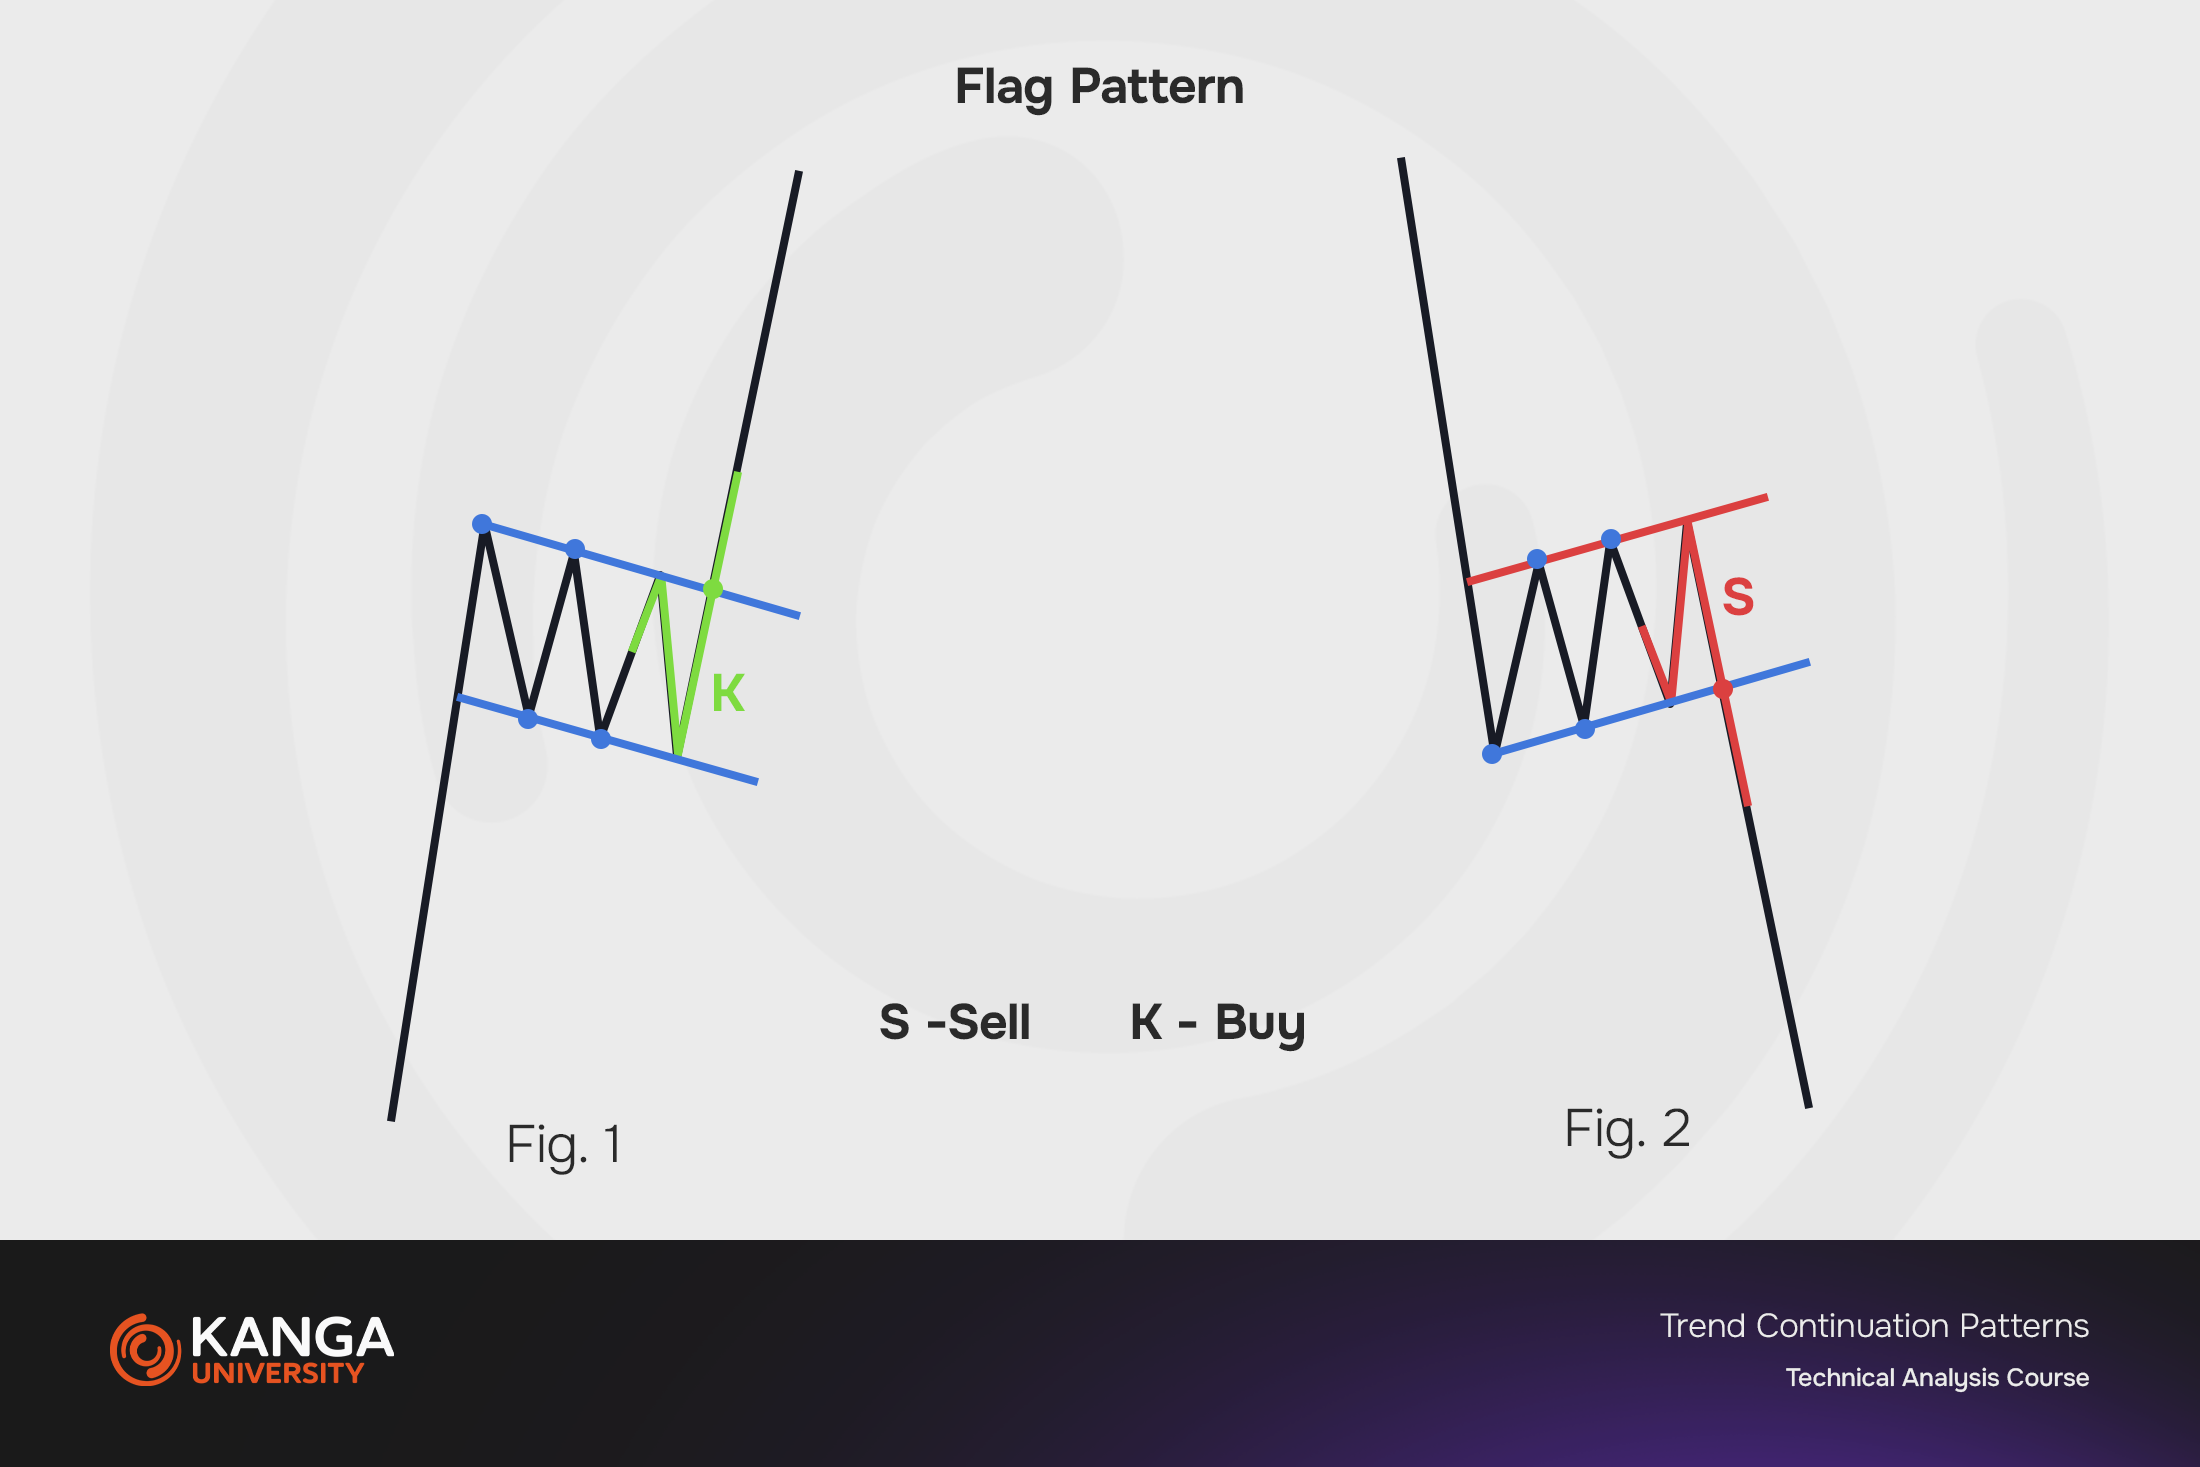
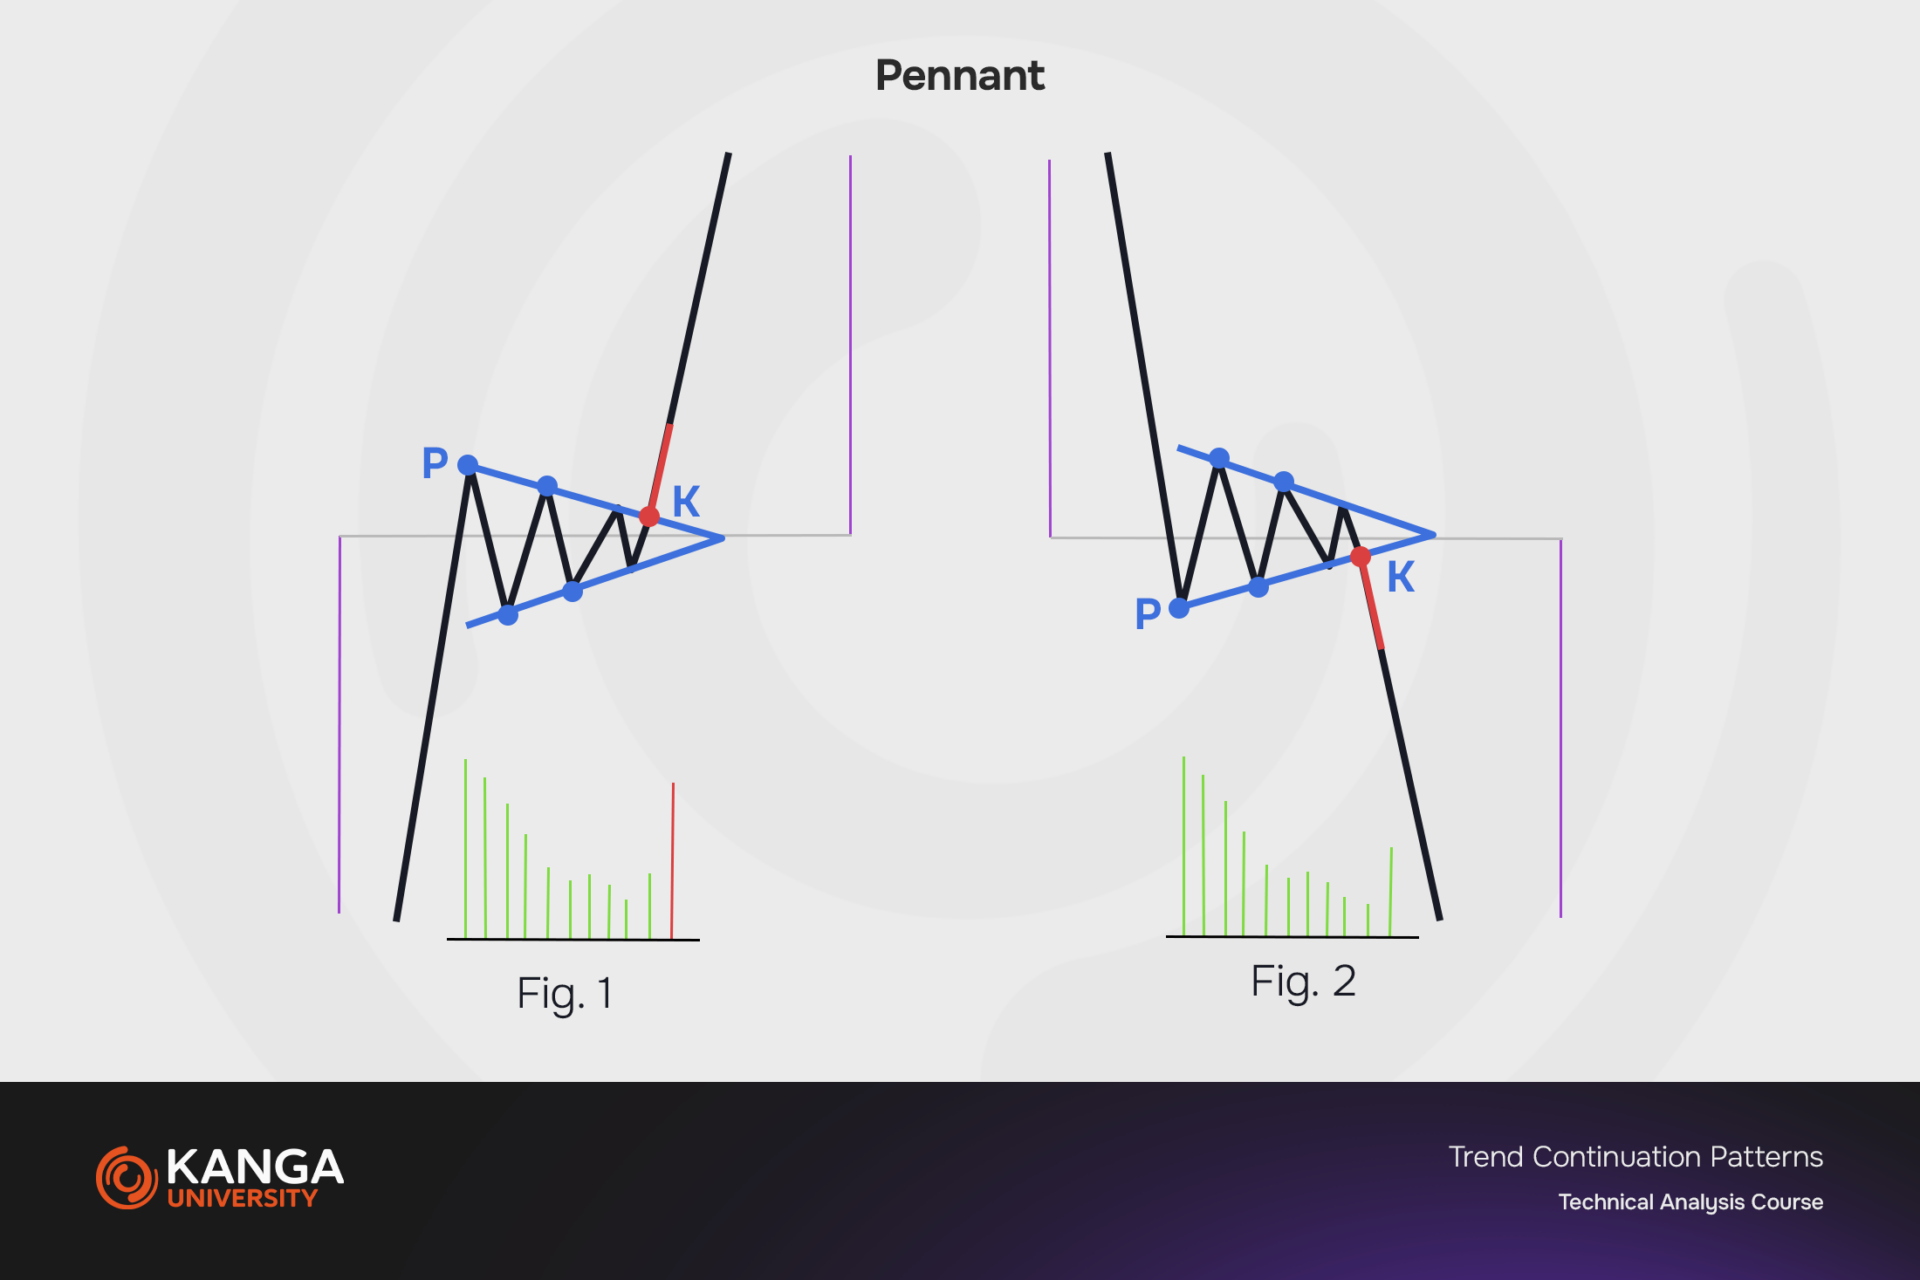
Flags and Pennants
Flags and pennants are short-term continuation patterns that appear in strong upward or downward trends. These patterns resemble flags on poles or small triangles and consist of two key components: a rapid and sharp price movement forming the flagpole, and a price consolidation forming the flag or pennant. This consolidation typically moves in the opposite direction to the preceding trend, and its breakout usually signals a continuation of the original trend.
Triangles
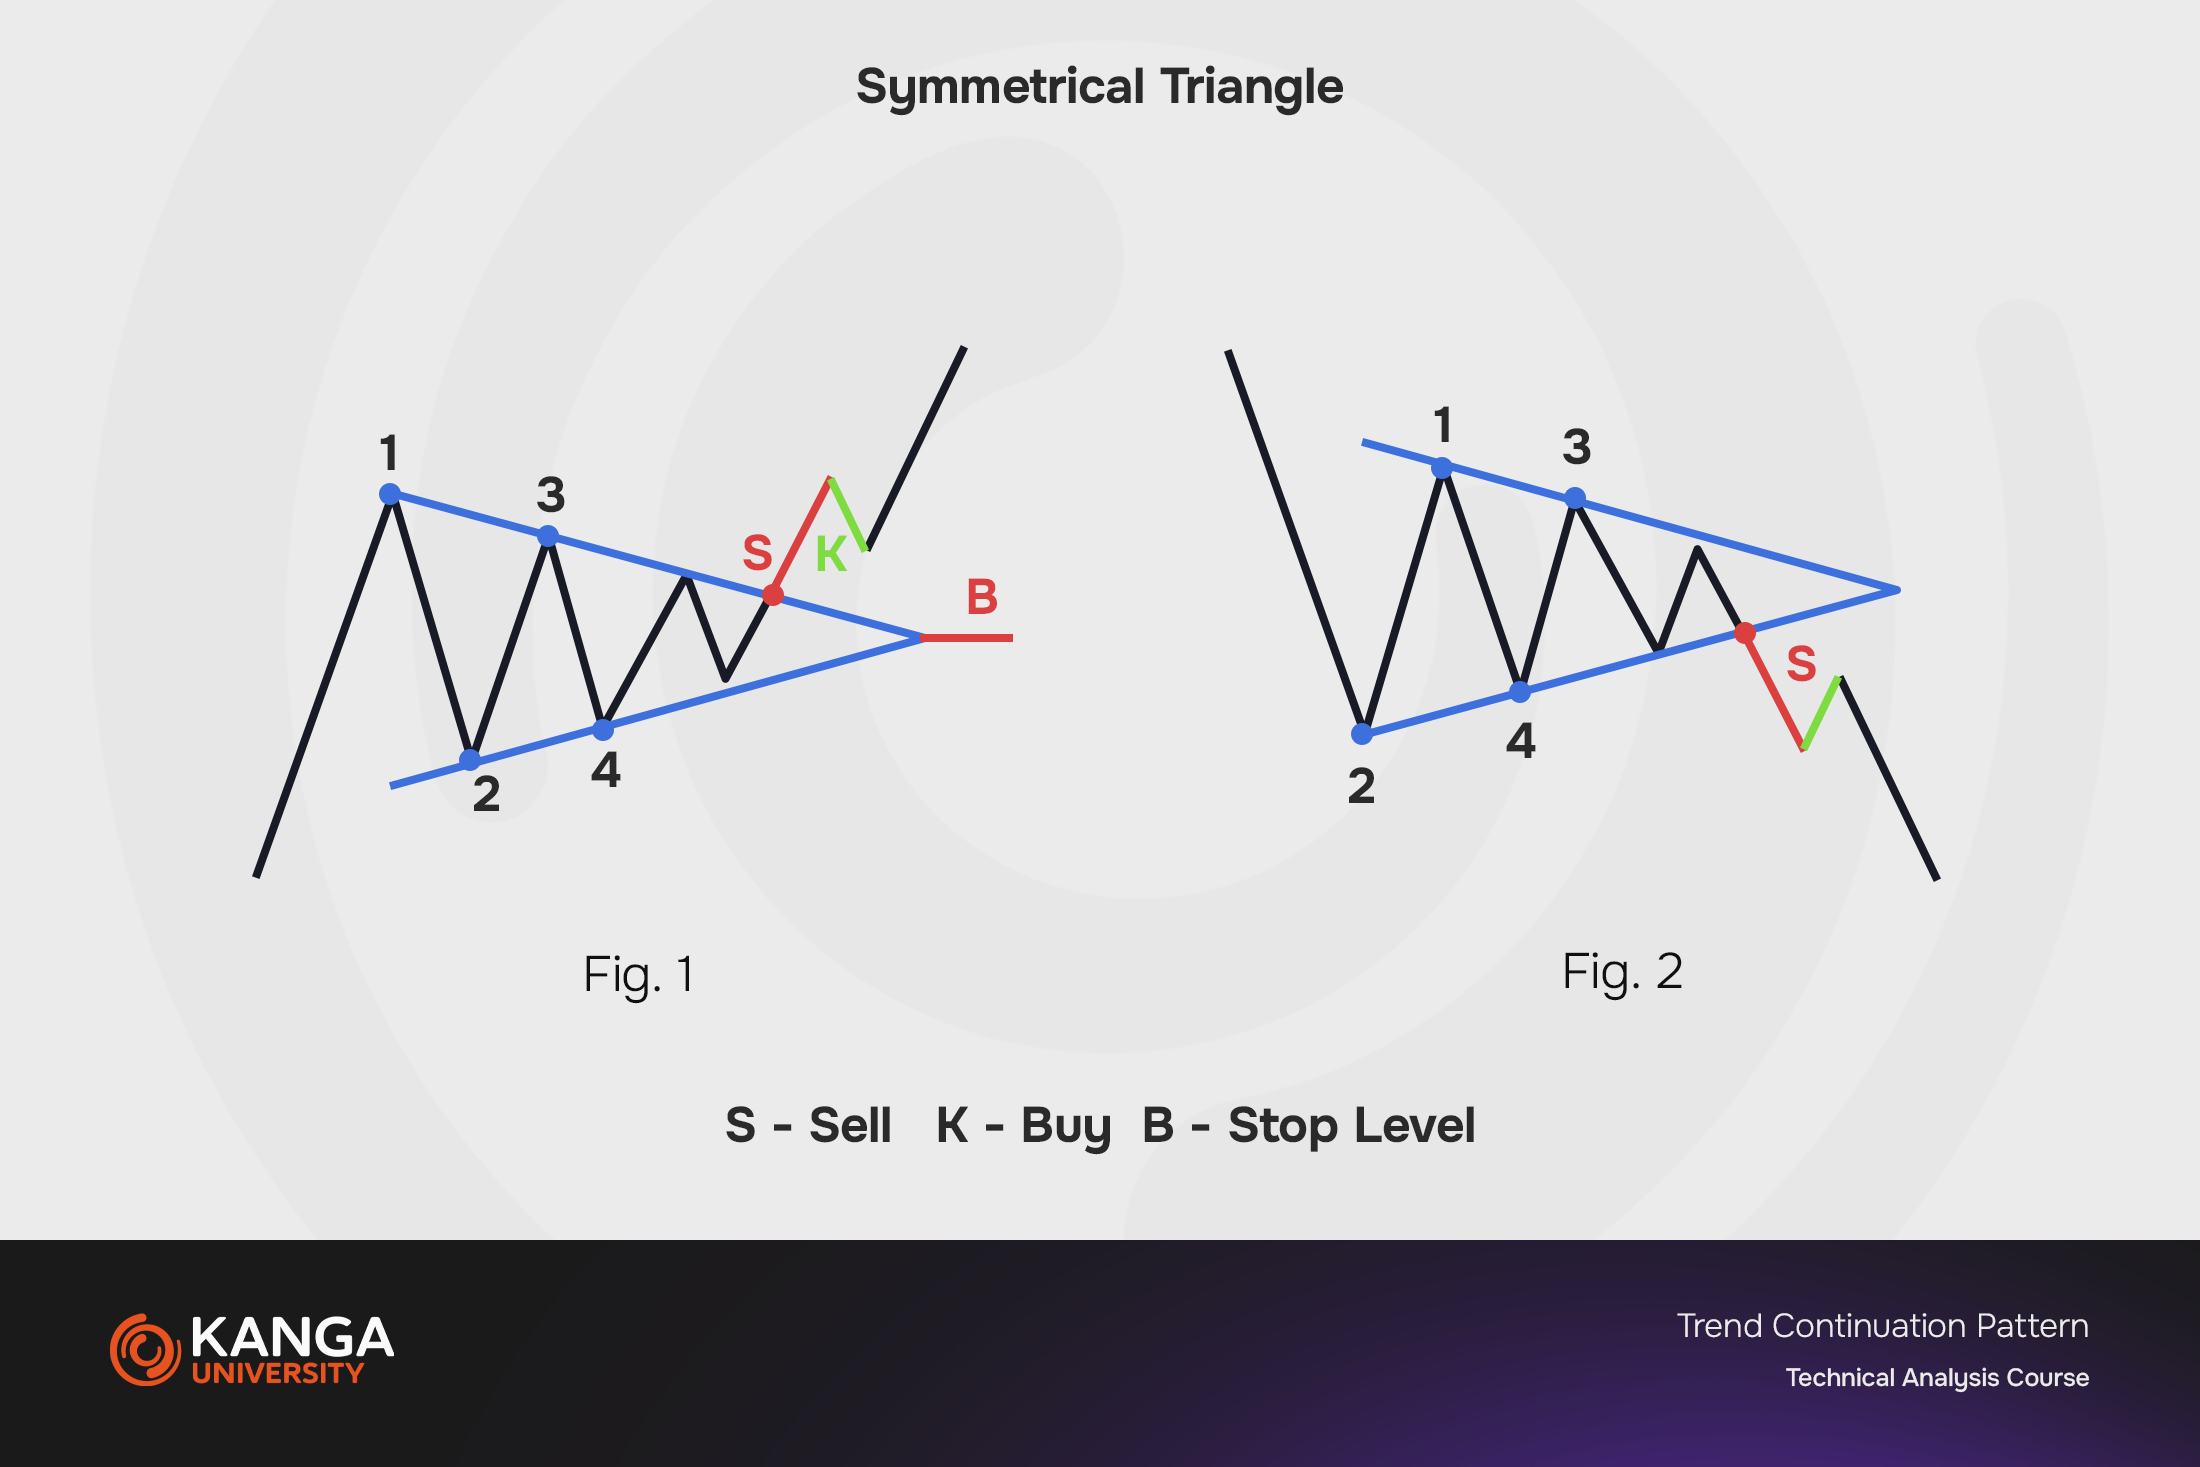
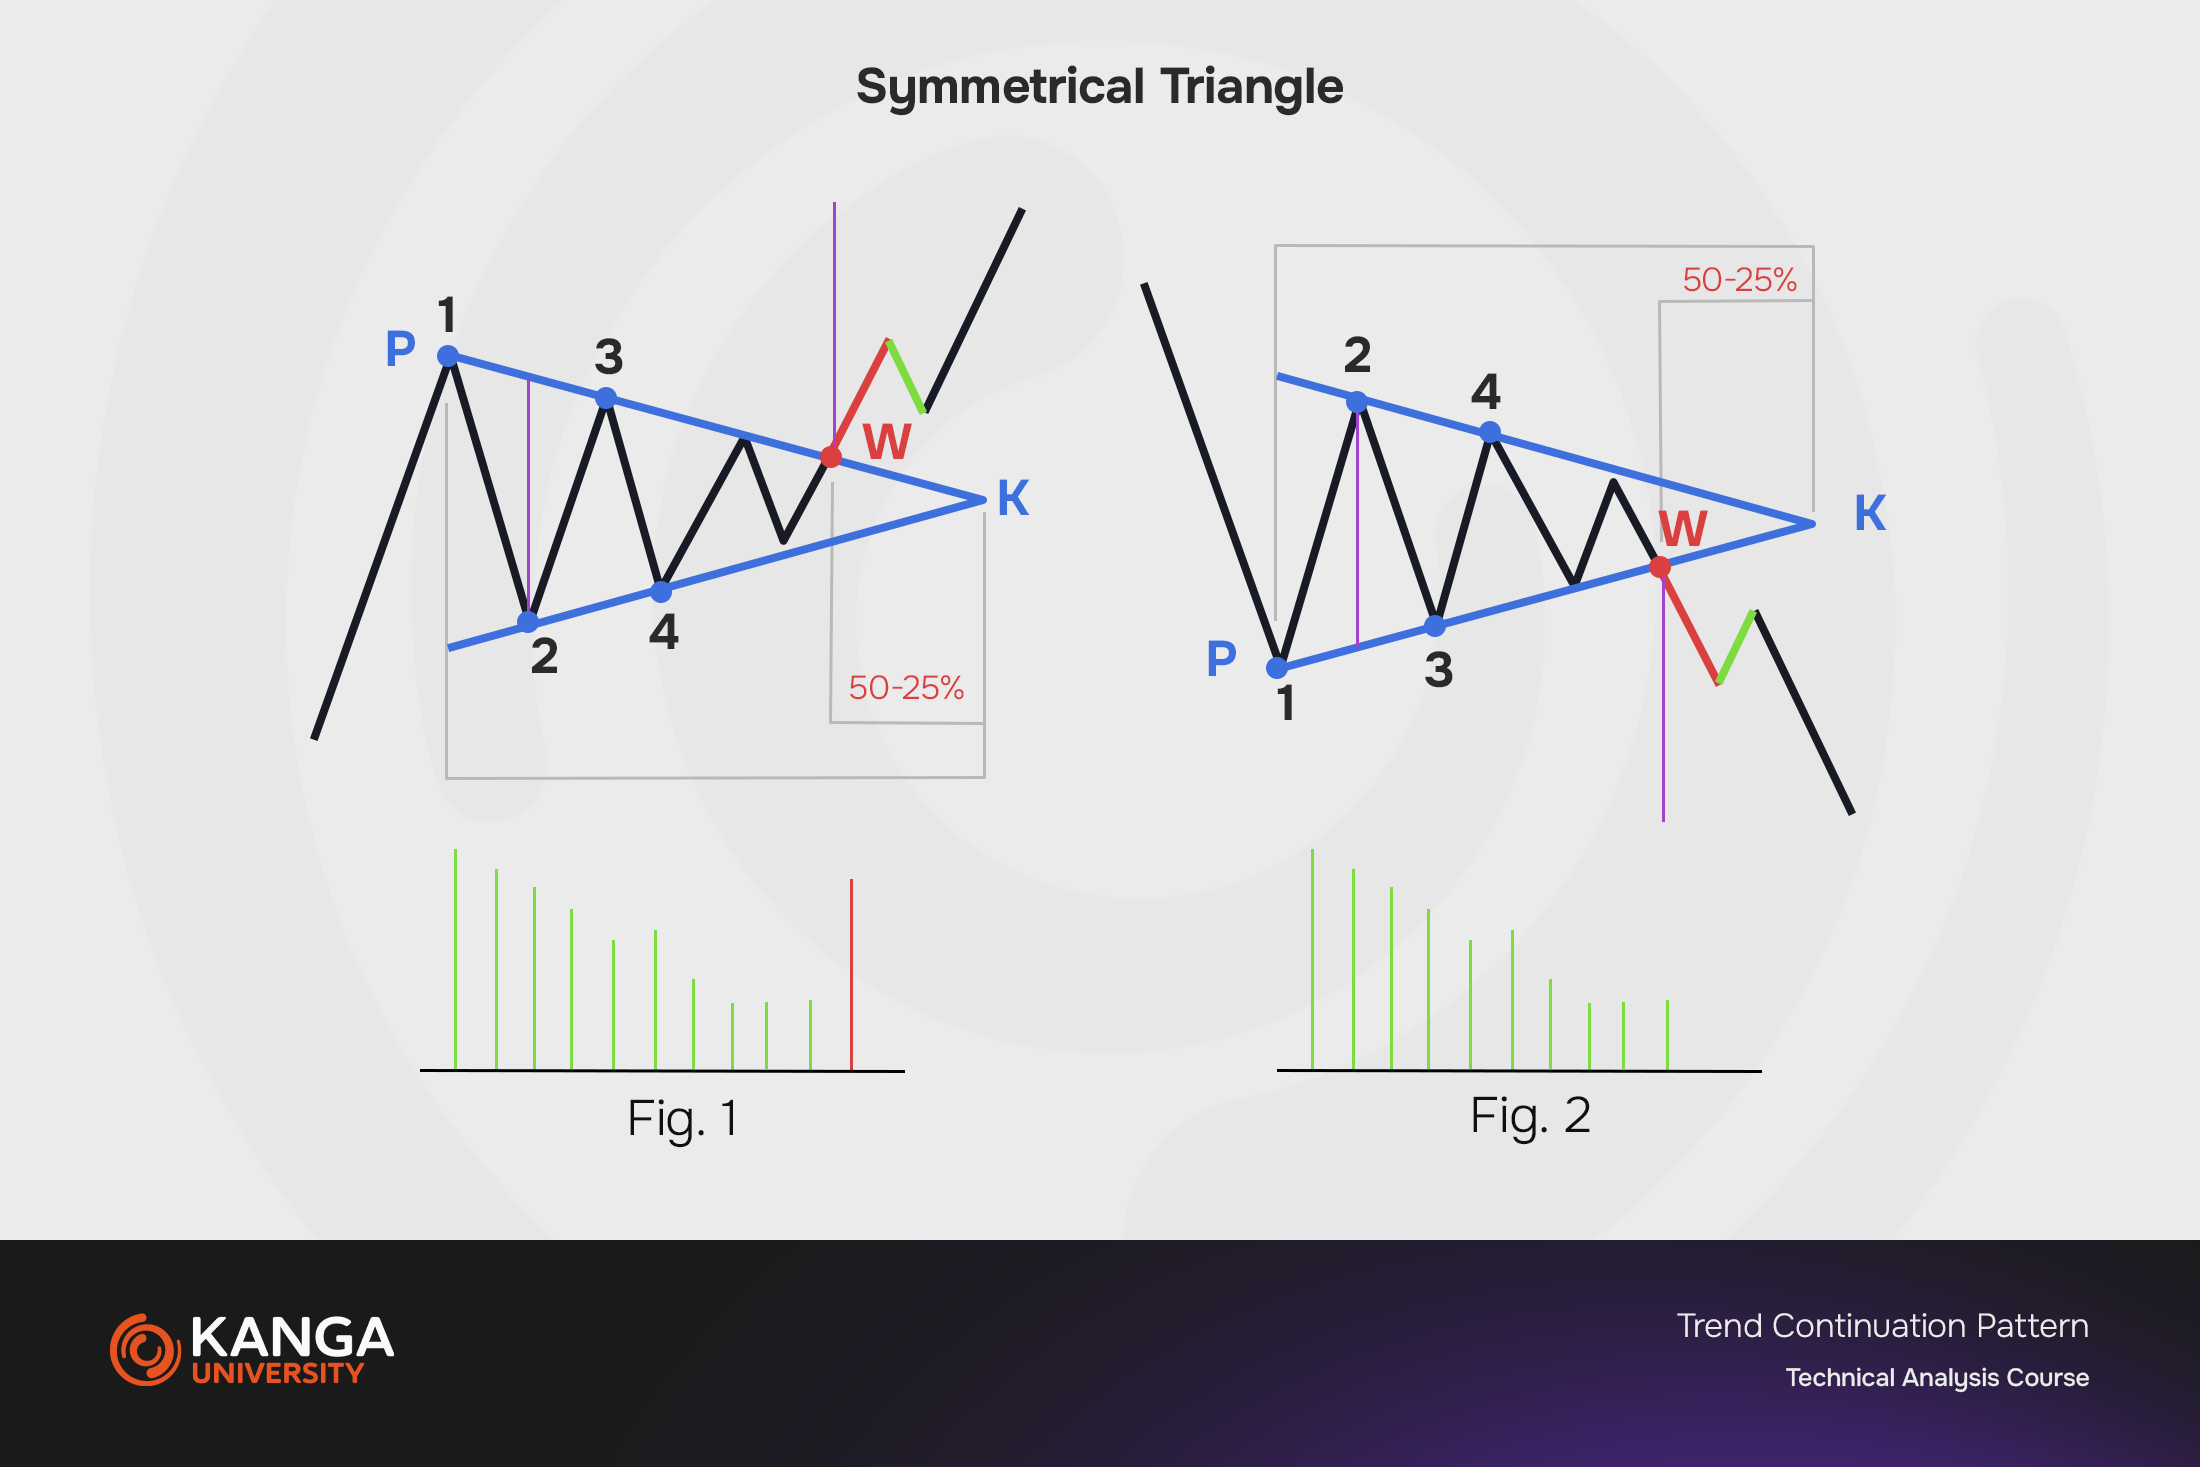
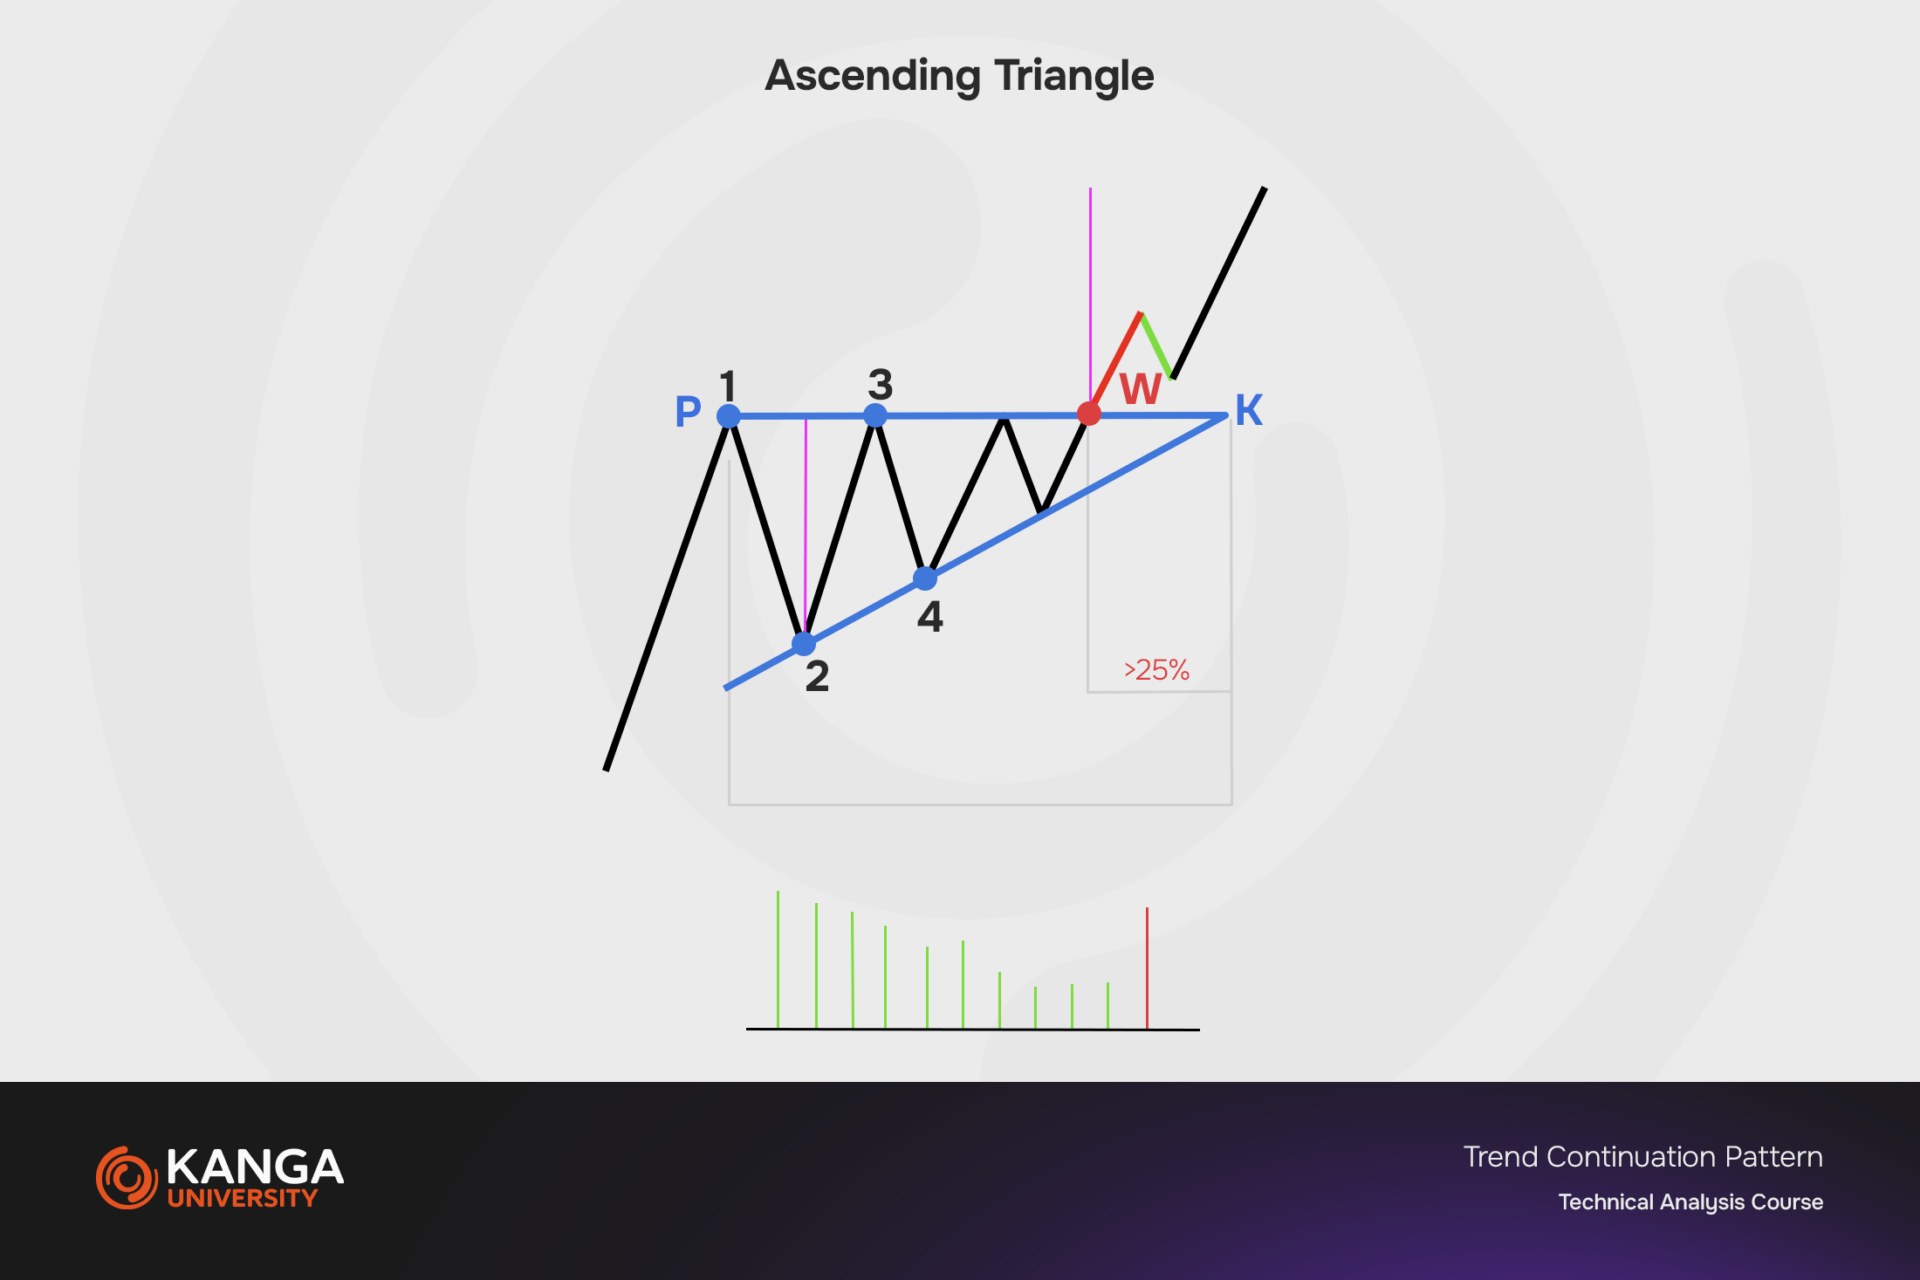
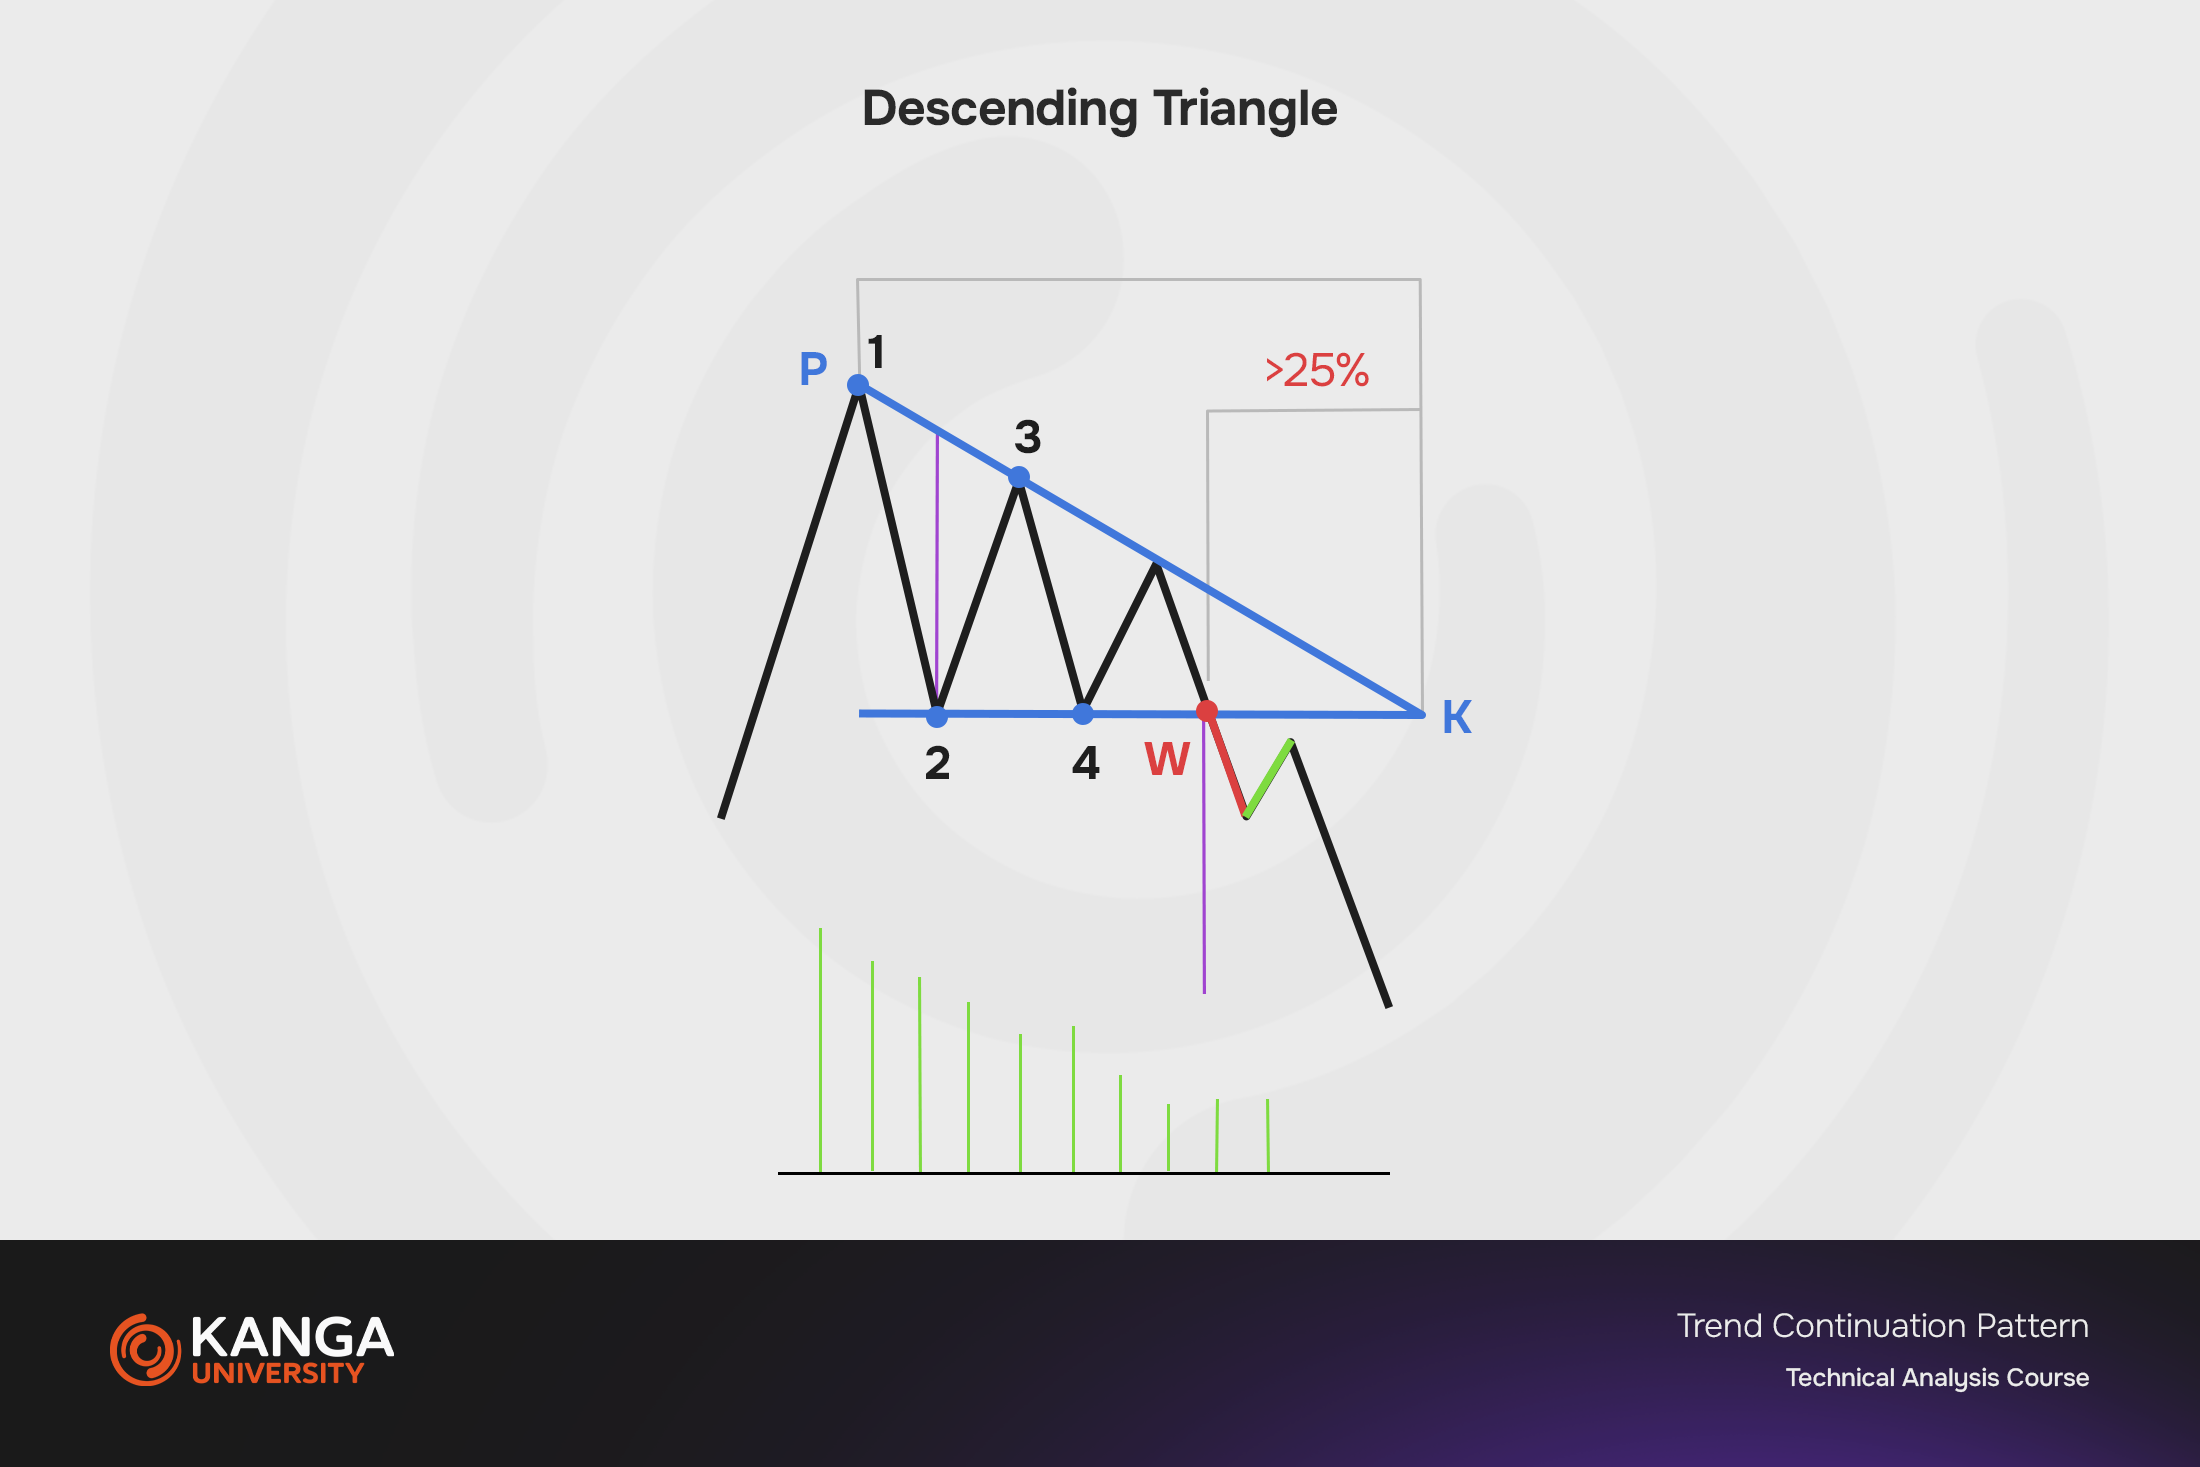
Triangles are formations that can serve as both continuation and reversal patterns, depending on the direction of the breakout. There are three main types of triangles: symmetrical, ascending, and descending.
-
Symmetrical triangles form when support and resistance lines converge, creating a triangle with converging trendlines.

-
Ascending triangles suggest stronger buying pressure, with a flatter resistance line and a rising support line.
-
Descending triangles indicate stronger selling pressure, with a descending resistance line and a flatter support line.
Rectangle (Flat Corrections)
Flat correction patterns occur when price moves within parallel support and resistance lines, creating a rectangle-like pattern. These formations are interpreted as consolidation periods before a trend resumes. The direction in which the price breaks out of the rectangle usually indicates the direction of the trend continuation.
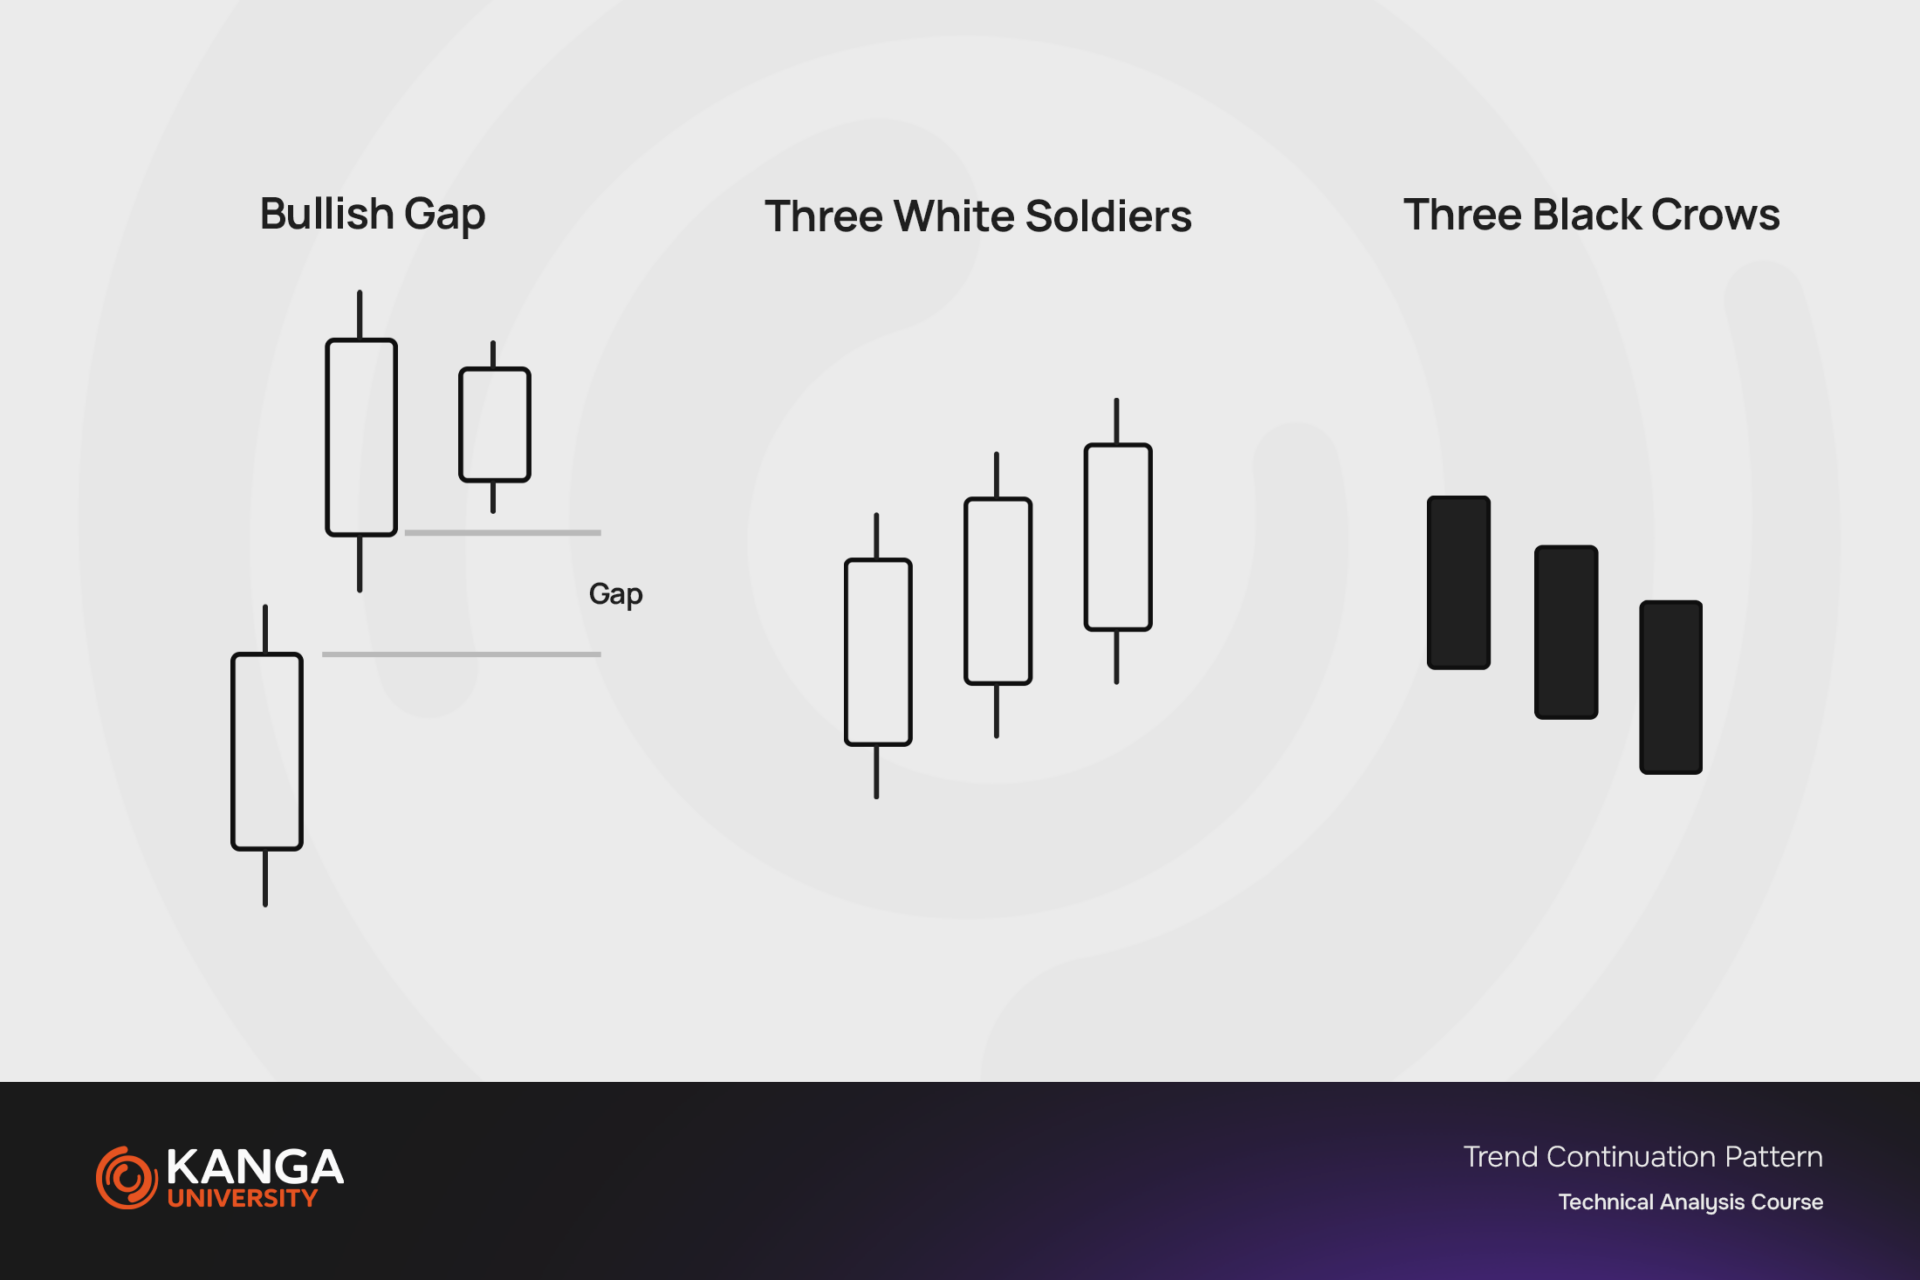
Breakaway Gaps (Bullish or Bearish Windows)
Bullish gaps (breakaway to the upside) and bearish gaps (breakaway to the downside) are patterns that occur when a price gap forms in the direction of the existing trend. These are strong continuation signals, as such gaps often act as future support or resistance zones.
Three White Soldiers and Three Black Crows
The Three White Soldiers (strong bullish trend) and Three Black Crows (strong bearish trend) patterns consist of three consecutive long candlesticks in the direction of the trend. These formations signal strong buying pressure (for Three White Soldiers) or strong selling pressure (for Three Black Crows) and are often indicators of trend continuation.
Summary
The key to effectively using these patterns is to understand that while they may suggest trend continuation, it is always important to seek confirmation and apply proper risk management. Therefore, investors and traders should also pay attention to other technical indicators and tools to make well-informed investment decisions.